2. 云南大学云南省国际河流与跨境生态安全重点实验室, 650091, 昆明
-
项目名称
- 云南省应用基础研究计划青年项目"金沙江流域气象-农业骤旱时空三维传播机理识别"(202201AU070064);西南林业大学科研启动项目"金沙江流域参考蒸散量(ET0)模型评估和归因分析"(112105)
-
第一作者简介
- 程清平(1987-), 男, 博士, 副教授, 硕士生导师。主要研究方向: 极端气候事件及其响应机制。E-mail: qpchengtyli@foxmail.com
-
文章历史
-
收稿日期:2022-10-18
修回日期:2023-11-03
2. 云南大学云南省国际河流与跨境生态安全重点实验室, 650091, 昆明
2. Yunnan Key Lab of International Rivers and Transboundary Eco-Security, Yunnan University, 650091, Kunming, China
全球气候变化加剧全球或区域尺度水文循环,干湿日动态演变是其主要表现之一,可能造成极端干旱或洪涝交替,严重威胁水资源及生态安全[1-3]。当前,基于逐日降水识别的干湿日指数是揭示水文及气候变化的关键指标,其对极端降水和干旱演变趋势具有重要的指示意义[1-2, 4-5]。吴少强等[4]基于持续干日指标构建干旱指数发现陕西省春秋旱趋于增加,Wang等[5]基于干湿日指数发现内蒙古地区中部及东北部干旱风险呈增加趋势。然而目前相关研究主要基于气象站点记录的原始观测降水数据,而未考虑自然和人为因素导致的降水误差。
准确的降水数据在揭示极端干旱和洪涝演变特征、水文气候模拟分析及其对生态环境造成的影响等方面扮演极其关键的角色。但目前各种标准雨量器观测的降水量(observed precipitation,Po)由于动力损失、微量降水和湿润损失等影响导致其远小于实际降水量[6],因而在分析降水量时空演变趋势和干湿气候分区等方面存在偏差。因此,许多学者致力于校正观测降水的损失量(corrected precipitation,Pc)。依据乌鲁木齐降水量观测误差对比试验推导出中国国家标准雨量筒的系统修正方法[7-8];以及利用矫正降水量揭示中国和区域尺度上年和月降水量变化趋势[6, 9]、小雨和暴雨[10-11]、干旱演变趋势[12]、融雪量[13]和气候分区[13]等均与观测降水量存在明显不同,且存在明显的区域差异。
金沙江流域发源于有“亚洲水塔”、“第三极”之称的青藏高原,作为重要的生态屏障区,具有涵养长江上游水源、防风固沙和生物多样性保护等重要功能,但复杂的生态环境及日益频繁的人类活动加剧了金沙江流域生态脆弱性与气候敏感性[14-16]。当前,金沙江流域尚未有基于Po和Pc识别的干湿日指数时空变化特征的对比研究。因而,笔者以金沙江流域为研究对象主要围绕2个问题展开:1)基于Po和Pc识别的金沙江流域干湿日指数时空演变特征是否存在差异?2)基于Po和Pc的干湿日指数在气候系统内部强迫和外部驱动因素影响方面是否存在差异?
1 研究区概况金沙江流域(E 90.47°~104.89°,N 24.54°~35.82°)流经横断山区,四川盆地,云贵高原,全长3 463 km,总面积为47.3万km2[14],依据三级流域划分标准,全流域可划分为金沙江上段,金沙江中下段及雅砻段(图 1),流域内高山峡谷相间并列,地势北高南低,落差约5 100 m,包括高原山地及季风、干热河谷和亚热带季风等气候区,且存在明显的垂直气候差异[14]。

|
图 1 金沙江流域气象站点分布及子流域划分 Fig. 1 Distribution of weather stations and division of subwatersheds in Jinsha River Watershed |
1961年1月1日至2020年12月31日逐日降水量、气温和风速等来源于中国气象局国家气象信息中心发布的中国地面气候资料日值数据集(V 3.0)(http://data.cma.cn/)。
参考Huang等[16]、Wang等[5]等通过绝对阈值法定义(日降水量≥1 mm定义该日为湿日,否则为干日)干湿日指数。且将14个干湿日指数划分为常规指标、极端指标、频率指标和结构指标4大类。基于经验系数法[6]校正主要由微量降水(ΔPt,mm)、蒸发损失(ΔPeva,mm)及湿润损失(ΔPwet,mm)导致的降水量偏差。采用Theill-Sen趋势估计[17]并结合修订的Mann-Kendall非参数检验法[18]识别干湿日指数变化趋势及显著性。利用空间场显著性检验Po和Pc识别的干湿日指数的显著变化趋势是由气候系统内部变率引起,还是外强迫[19-20]。此外,进一步计算Po和Pc识别的干湿日指数值相对误差(Rv,%)、变率(气候变化率,即气候从一种状态变到另一种状态的速度)相对误差(Rs,%)用以分别量化降水校正前后干湿日指数值及变率差额幅度。干湿日指数定义详见表 1。
| 表 1 干湿日指数定义 Tab. 1 Definition of dry and wet spell indices |
从变化趋势来看,全流域干日或湿日指数普遍趋于增长或降低(图 2)。除干日指数中年单次最长干日事件持续(MLDS),湿日指数中湿日事件数量(NWS)和1年中当日为湿日但前日为干日的时间比例(FDW)校正前相比校正后变化趋势相反外,其余干湿日指数均表现为校正前后变化速率一致,且存在空间差异。具体来看,金沙江上段干湿日指数变化速率相比校正前变化率偏低(幅度为0.14%~38.53%),其中干日事件数量(NDS)变化率幅度偏低最小,MLDS最大;金沙江中下段干湿日指数变化率相比校正前偏大(幅度为3.64%~108.47%),其中以年极端湿日事件的总降水量(PWS 95)差异最小,年极端干日事件的总时间(DDS 95)偏差最大;雅砻段干日指数NDS、MLDS、DDS 95、1年中当日为干日但前日为湿日的比例(FWD)及湿日事件数量(NWS)、湿日事件平均持续时间(FDW)变化率相比校正前偏小(幅度为3.97%~35.63%),以DDS 95最小,FDW最大,其余干湿日指数变化率相较于校正前偏大(幅度为19.19%~600.27%),以1年中当日及前日均为湿日时间比例(FWW)校正偏差最小,1年中当日及前日均为干日时间比例(FDD)最大。

|
*表示修订的Mann-Kendall趋势检验统计值|Z|≥1.96,即在0.05级别(双尾)趋势显著;方格内括号外(内)值分别为Po(Pc)识别的干湿日指数;变率均乘以10。 * indicates the modified Mann-Kendall trend test statistical value |Z|≥1.96, refers to a significant trend at level 0.05 (double-tailed); the values outside/inside the brackets in the square are respectively the Po-and Pc-based slopes of dry and wet spell indices; the slope shown has been multiplied by 10. 图 2 1961—2020年金沙江流域基于Po和Pc识别的干湿日指数趋势特征及变率相对误差 Fig. 2 Po- and Pc-based trend characteristics of dry and wet spell indices and relative error of slope in Jinsha River Watershed from 1961 to 2020 |
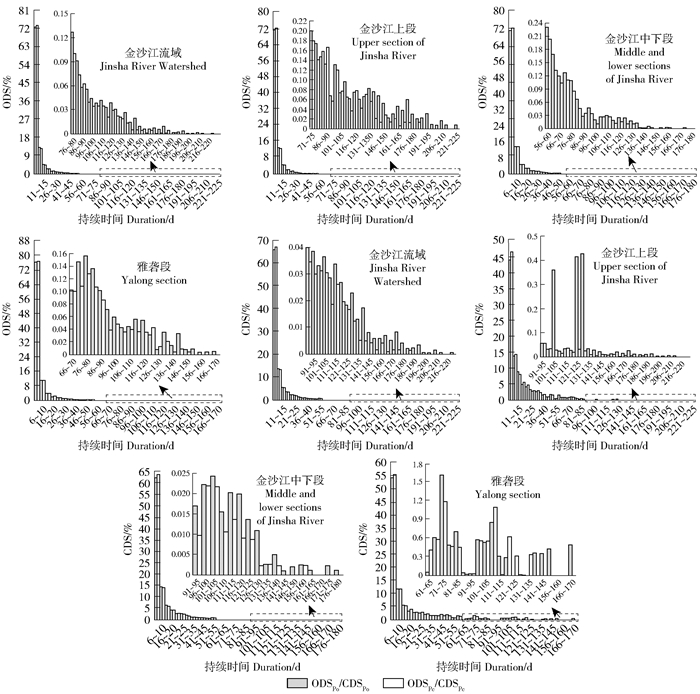
如图 3所示,年不同持续干日频率(ODS)相较于校正前偏小;年不同持续湿日频率(OWS)相较于校正前偏大。具体来看,全流域Pc识别的最长持续干日由221~225 d减少到181~185 d,其贡献率(CDS)由0.002%减少为0.001%,最长持续湿日由28 d增加到31 d其贡献率(CWS)由0.001%上升为0.51%;金沙江上段最长持续干日由221~225 d减少到181~185 d,其CDS由0.014%减少为0.008%,最长持续湿日CWS由0.007%上升为0.008%。金沙江中下段最长持续干日由176~180 d减少为156~160 d,其CDS由0.003%减少为0.001%,最长持续湿日由19 d增加到23 d,其CWS由0.001%上升为0.001 2%。雅砻段最长持续干日由166~170 d减少到146~150 d,其CDS由0.005%减少为0.004%,最长持续湿日由28 d增加到31 d,其CWS由0.004%上升为0.005%。

|
图 3 1961—2020年金沙江流域基于Po和Pc识别的多年平均干日结构型指数 Fig. 3 Po- and Pc-based multi-year average of dry spell structure type indices in Jinsha River Watershed from 1961 to 2020 |
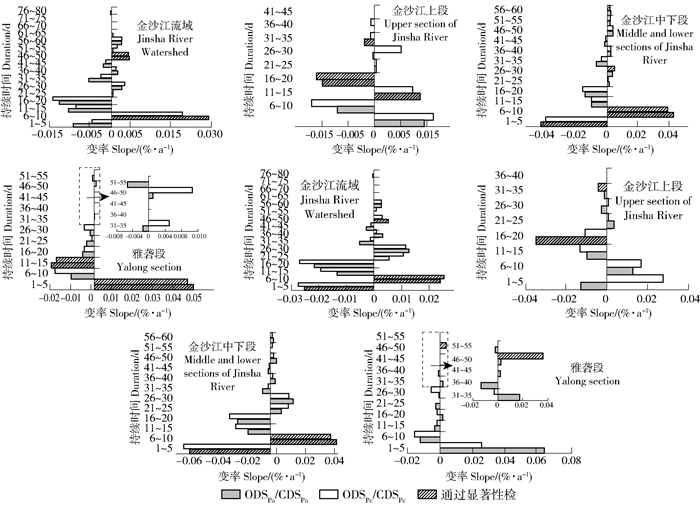
如图 4所示,从变化趋势来看,降水校正后ODS变化趋势整体减弱,全流域6~10 d的ODS从显著增长转为不显著增长;从子流域来看,金沙江上段11~15 d、31~35 d的ODS及中下段的1~5 d的ODS趋势由显著减少转为不显著;从CDS来看,金沙江上段16~20 d,中下段1~5 d、46~50 d由显著减少转为不显著;而金沙江上段31~35 d,中下段的6~10 d、21~25 d、56~60 d及雅砻段46~50 d由不显著增长转为显著。

|
图 4 1961—2020年金沙江流域基于Po和Pc识别的干日结构型指数(ODS,CDS)趋势特征 Fig. 4 Po- and Pc-based trend characteristics of dry spell structure type indices (ODS, CDS) in Jinsha River Watershed from 1961 to 2020 |
进一步来看,全流域降水校正后的OWS和CWS变化趋势整体增强,最为明显的为金沙江上段3 d和7 d的OWS,中下段10 d的OWS,雅砻段1 d的OWS均存在由显著增长(减少)趋势转为不显著。对于CWS,金沙江上段2 d和3 d的CWS趋势由显著增长(减少)转为不显著;金沙江中下段12 d,雅砻段3 d和5~6 d的CWS趋势由不显著增长(减少)转为显著;雅砻段4 d的CWS由负趋势转为正趋势。
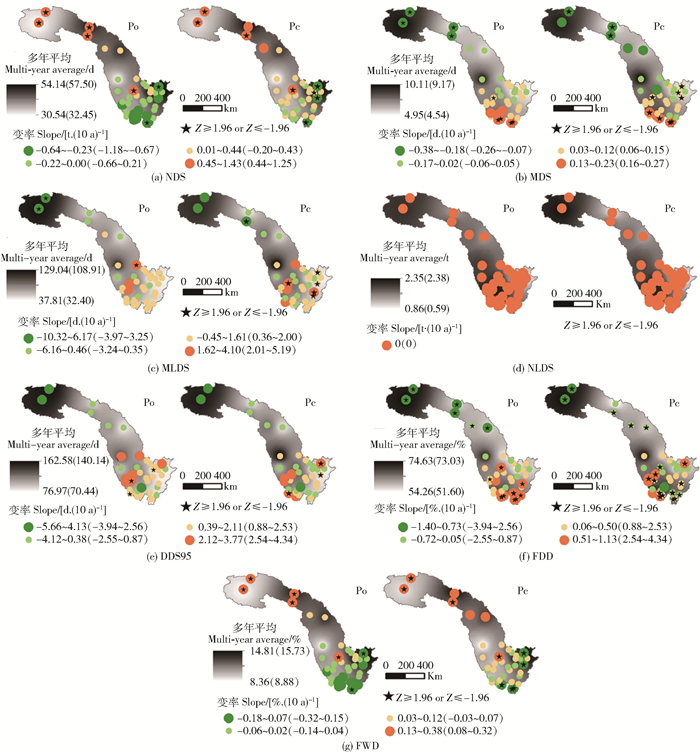
从空间分布(图 5)来看,Pc识别的干湿日指数值空间分布仍与Po较一致。Po和Pc识别的平均干日事件持续时间(MDS)、MLDS、年长持续干日事件数量(NLDS)、DDS 95和FDD以增长趋势为主,且除Pc识别的DDS 95呈增长态势的站点较Po减少9.76%外,Pc识别的其余干湿日指数呈增长态势的站点较Po增加4.88%~7.32%。Po和Pc识别的NDS、FDW、NWS、MWS、年单次最长湿日事件持续时间(MLWS)、PWS95以降低趋势为主,且Pc识别的NDS和平均干日事件持续时间(MDS)呈降低态势的站点较Po减少2.44%~9.76%,而Pc识别的其余干湿日指数呈降低态势的站点较Po反而增加2.44%~9.76%。此外,流域内存在Po和Pc识别的干湿日指数呈相反趋势的站点,以PWS 95最多,FDD最少。在趋势显著程度上,Po和Pc识别的MWS、MLWS、PWS 95、FWW趋于显著降低的站点多于趋于显著增长的站点,其站点比例校正幅度为-2.44%~2.44%;具体来看,Po和Pc识别的MDS、NLDS、DDS 95、FDD趋于显著增长的站点多于趋于显著降低的站点,其站点比例校正幅度为0~9.76%;Pc识别的NWS、NDS、FDW、MPWS趋于显著增长和降低的站点一致,站点比例校正幅度为-2.44%~4.88%;Po识别的MLDS、FWD以趋于显著下降/增长的站点多于趋于显著增长/下降的站点,而Pc识别的MLDS、FWD表现为趋于显著增长/下降的站点多于趋于显著降低/增长的站点。

|
Po/Pc识别的干日指数多年平均和变率分别位于括号外/内。 Po-based/Pc-based the multi-year average and slope of dry spell indices are outside/inside the brackets. 图 5 1961—2020年金沙江流域基于Po和Pc识别的干日指数空间特征 Fig. 5 Po- and Pc-based spatial characteristics of dry spell indices in Jinsha River Watershed from 1961 to 2020 |
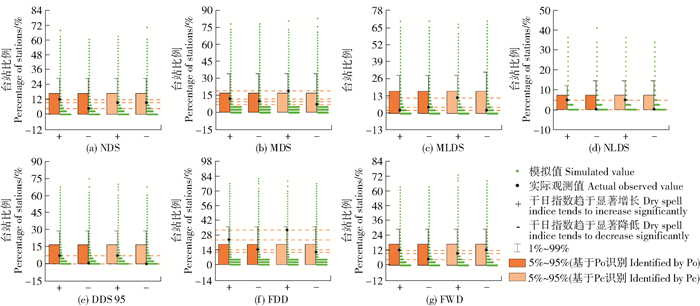
空间场显著性检验结果表明,Po和Pc识别的多数干湿日指数趋势呈显著的台站比例仍在气候系统内部变率范围内,仅Po和Pc识别的FDD趋于显著增长和MWS、MLWS、PWS 95、FWW趋于显著降低的台站及Pc识别的MDS呈显著增长的台站比例显著区别于气候系统内部变率,与外强迫作用有关(图 6)。

|
图 6 1961—2020年干日指数呈显著增长和减少趋势的台站比例模拟值分布及实际观测值 Fig. 6 Percentage distribution of simulated values and actual observed values of stations with significant increase and decrease trends of dry spell indices from 1961 to 2020 |
Yao等[12]发现基于Po和Pc识别的中国不同区域的Erinc's指数差异明显,而标准化蒸散指数变化微弱。Li等[13]应用Pc进行气候带划分时发现中国实际气候区划比原始降水量划分的结果更为湿润。Ye等[21]指出黄河上游校正降水会使径流与蒸散系数更大从而影响地表水文模型耦合。目前,未有干湿日时空格局及驱动因素研究中考虑降水误差产生的影响[1-5, 22-24]。金沙江流域研究表明1961—2020年Pc识别的全流域干日指数普遍低于Po识别的干日指数,Pc识别的湿日指数普遍高于Po,且不同子流差异明显。趋势上,Pc识别的金沙江上段干湿日指数趋势较Po普遍偏小,尤以金沙江中下段更为明显。
毋庸置疑,校正降水量较原始观测的在数量和演变趋势存在明显的差异[6-13]。Zhang等[11]进一步详细阐述风速、湿损失和微量降水及三者综合导致这种差异的原因。因而金沙江流域基于Po和Pc识别的干湿日指数值和演变趋势的差异也与风速、湿损失和微量降水导致的误差有密切的关系。基于校正降水量识别的干湿日降水结构指数能较为全面反映该流域降水结构演变特征。因此,该流域在水土保持规划、农业生产和生态水文模型的建立等方面应考虑校正降水量更具有实际科学参考价值。
进一步对比Po和Pc识别的干湿日指数显著变化趋势是气候系统内部变率驱动还是外强迫作用时,发现Po和Pc识别的大多数干湿日指数的显著变化趋势的站点比例均处于气候系统内部变率内,仅Po和Pc识别的MDS呈显著增长的站点比例由不显著转为显著区别于气候系统内部变率。因此,校正降水并未改变气候内部变率与外部强迫对干湿日指数变化趋势的影响。
此外,干湿日指数计算前提是对干湿日进行合理判定,其方法包括绝对阈值法[1-2, 4-5, 22-24]与相对阈值法[21]。国内常将1 mm[4-5]或0.1 mm[25]的绝对阈值应用于降水和干旱研究,笔者基于气候变化监测和指标专家组提出的1 mm绝对阈值计算干湿日指数,未来可考虑0.1 mm计算干湿日指数对降水校正误差的响应差异。
5 结论1) Pc识别的干日指数值相较于Po普遍更低,而湿日普遍偏高,但空间分布近似一致。相较于Po,Pc识别的干湿日指数趋势总体上在金沙江上段偏小,于金沙江中下段偏大,而雅砻江段表现为湿日指数趋势偏大,干日指数趋势偏小。
2) 空间场显著性检验表明,Po和Pc识别的干湿日指数显著变化趋势主要由气候系统内部变率解释,仅Po(Pc)识别的MWS、MLWS、PWS 95、FWW(FDD)呈显著降低(增长)的台站比及Pc识别的MDS趋于显著增长的台站比例可能受到外强迫驱动。
综上,无论是Pc还是Po的识别的干湿日指数,呈显著变化趋势的台站比例均主要由气候系统内部变率主导,即气候变化对金沙江影响十分明显。因此,金沙江流域需要采取合理的措施来应未来可能出现的极端事件(高温、干旱和洪涝及其复合事件等)对农业生产和生态系统造成的威胁。
| [1] |
WAINWRIGH C, ALLAN R, BLACK E. Consistent trends in dry spell length in recent observations and future projections[J]. Geophysical Research Letters, 2022, 49(12): e2021GL097231. DOI:10.1029/2021GL097231 |
| [2] |
AYAR P V, MAILHOT A. Evolution of dry and wet spells under climate change over north-eastern North America[J]. Journal of Geophysical Research: Atmospheres, 2021, 126(5): e2020JD033740. DOI:10.1029/2020JD033740 |
| [3] |
芮广军, 孙朋, 杨会宁, 等. 1959—2018年淮河流域干湿格局时空动态研究[J]. 中国水土保持科学, 2022, 20(4): 74. RUI Guangjun, SUN Peng, YANG Huining, et al. Spatio-temporal dynamics of dry-wet patterns in the Huaihe River Basin from 1959 to 2018[J]. Science of Soil and Water Conservation, 2022, 20(4): 74. |
| [4] |
吴少强, 汤崇军, 郑太辉, 等. 基于连续无有效降雨日数指标的江西省干旱时空分布特征[J]. 长江流域资源与环境, 2022, 31(4): 903. WU Shaoqiang, TANG Chongjun, ZHENG Taihui, et al. Sptio-temporal characteristics of drought in Jiangxi based on index of continuous days without available precipitation[J]. Resources and Environment in the Yangtze Basin, 2022, 31(4): 903. |
| [5] |
WANG Yixuan, GAO Ruizhong, WANG Xixi, et al. Long-term spatiotemporal variability in occurrences of wet and dry days across South Mongolian Plateau[J]. Atmospheric Research, 2021, 262: 105795. DOI:10.1016/j.atmosres.2021.105795 |
| [6] |
叶柏生, 杨大庆, 丁永建, 等. 中国降水观测误差分析及其修正[J]. 地理学报, 2007, 62(1): 3. YE Baisheng, YANG Daqing, DING Yongjian, et al. A Bias- corrected precipitation climatology for China[J]. Acta Geographica Sinica, 2007, 62(1): 3. |
| [7] |
杨大庆, 姜彤, 张寅生, 等. 天山乌鲁木齐河源降水观测误差分析及其改正[J]. 冰川冻土, 1988, 10(4): 384. YANG Daqing, JIANG Tong, ZHANG Yinsheng, et al. Analysis and correction of errors in precipitation measurement at the head of Urumqi River, Tianshan[J]. Journal of Glaciology and Geocryology, 1988, 10(4): 384. |
| [8] |
杨大庆, 施雅风, 康尔泗, 等. 乌鲁木齐河源高山区固态降水对比测量的主要结果[J]. 科学通报, 1990(22): 1734. YANG Daqing, SHI Yafeng, KANG Ersi, et al. Main Results of comparative measurement of solid precipitation in the alpine area of the headwaters of Urumqi River[J]. Chinese Science Bulletin, 1990(22): 1734. |
| [9] |
DING Yongjian, YANG Daqing, YE Basheng, et al. Effects of the bias correction on precipitation trend over China[J]. Journal of Geophysical Research: Atmospheres, 2007, 112(D13). |
| [10] |
ZHANG Yingxian, REN Yuyu, REN Yuyu, et al. Bias correction of gauge data and its effect on precipitation climatology over mainland China[J]. Journal of Applied Meteorology and Climatology, 2019, 58(10): 2177. DOI:10.1175/JAMC-D-19-0049.1 |
| [11] |
ZHANG Yingxian, REN Yuyu, REN Guoyu, et al. Precipitation trends over mainland China from 1961-2016 after removal of measurement biases[J]. Journal of Geophysical Research: Atmospheres, 2020, 125: e2019JD031728. DOI:10.1029/2019JD031728 |
| [12] |
YAO Ning, LI Yi, LI Na, et al. Bias correction of precipitation data and its effects on aridity and drought assessment in China over 1961-2015[J]. Science of the Total Environment, 2018, 639: 1015. DOI:10.1016/j.scitotenv.2018.05.243 |
| [13] |
LI Na, LI Yi, YAO Ning. Bias correction of the observed daily precipitation and re-division of climatic zones in China[J]. International Journal of Climatology, 2018, 38(8): 3369. DOI:10.1002/joc.5506 |
| [14] |
史雯雨, 杨胜勇, 李增永, 等. 近57年金沙江流域气温变化特征及未来趋势预估[J]. 水土保持研究, 2021, 28(1): 211. SHI Wenyu, YANG Shengyong, LI Zengyong, et al. Variation characteristics and the future trend estimation of temperature in Chinsha River Basin over the past 57 years[J]. Research of Soil and Water Conservation, 2021, 28(1): 211. |
| [15] |
张珂, 鞠艳, 李致家. 金沙江流域实际蒸散发遥感重建及时空特征分析[J]. 水科学进展, 2021, 32(2): 182. ZHANG Ke, JU Yan, LI Zhijia. Satellite-based reconstruction and spatiotemporal variability analysis of actual evapotranspiration in the Jinshajiang River basin, China[J]. Advances in Water Science, 2021, 32(2): 182. |
| [16] |
HUANG Jin, CHEN Xin, XUE Yan, et al. Changing characteristics of wet/dry spells during 1961-2008 in Sichuan province, Southwest China[J]. Theoretical and Applied Climatology, 2017, 127(1): 129. |
| [17] |
THEIL H. Henri Theil's contributions to economics and econometrics[M]. Springer Netherlands, 1992: 345.
|
| [18] |
HAMED K H, RAMACHANDRAR A. A modified Mann-Kendall trend test for autocorrelated data[J]. Journal of Hydrology, 1998, 204: 182. DOI:10.1016/S0022-1694(97)00125-X |
| [19] |
LI Wei, CHEN Yang. Detectability of the trend in precipitation characteristics over China from 1961 to 2017[J]. International Journal of Climatology, 2021, 41(S1): E1980. |
| [20] |
江洁, 周天军, 张文霞. 近60年来中国主要流域极端降水演变特征[J]. 大气科学, 2022, 46(3): 707. JIANG Jie, ZHOU Tianjun, ZHANG Wenxia. Temporal and spatial variations of extreme precipitation in the main river basins of China in the past 60 years[J]. Chinese Journal of Atmospheric Sciences, 2022, 46(3): 707. |
| [21] |
YE Baisheng, YANG Daqing, MA Lijuan. Effect of precipitation bias correction on water budget calculation in Upper Yellow River, China[J]. Environmental Research Letters, 2012, 7: 025201. DOI:10.1088/1748-9326/7/2/025201 |
| [22] |
THOITHI W, BLAMEY R, REASON C. Dry spells, wet days, and their trends across southern Africa during the summer rainy season[J]. Geophysical Research Letters, 2021, 48: e2020GL091041. DOI:10.1029/2020GL091041 |
| [23] |
李晨曦, 曾子旋, 洪海旭, 等. 东北春季极端连续无雨日与前冬北太平洋海平面气压的可能联系[J]. 气象科学, 2022, 42(2): 143. LI Chenxi, ZENG Zixuan, HONG Haixu, et al. Possible relationship between spring extreme consecutive dry days over Northeast China and North Pacific sea level pressure in the preceding winter[J]. Journal of Meteorological Sciences, 2022, 42(2): 143. |
| [24] |
李剑锋, 张强, 白云岗, 等. 新疆地区最大连续降水事件时空变化特征[J]. 地理学报, 2012, 67(3): 312. LI Jianfeng, ZHANG Qiang, BAI Yungang, et al. Spatio-temporal probability behaviors of the maximum consecutive wet days in Xinjiang, China[J]. Acta Geographica Sinica, 2012, 67(3): 312. |
| [25] |
RIVOIRE P, TRAMBLAY Y, NEPPEL L, et al. Impact of the dry day definition on Mediterranean extreme dry spells analysis[J]. Natural Hazards and Earth System Sciences, 2019, 1629. |
 2024, Vol. 22