2. 河南省地质物探测绘技术有限公司, 450099, 郑州
-
项目名称
- 国家自然科学基金"基于土壤分类的土壤剖面质量形成研究"(41201209);河南省教育厅科学技术研究重点项目"高潜水位平原区采煤塌陷地复垦土壤剖面生产力评价"(13A210495);河南省科技攻关项目"基于土地生态安全的基本农田调整与管护研究"(182102110073)
-
第一作者简介
- 薛志斌(1990-), 男, 硕士研究生。主要研究方向:土地资源管理和土地评价。E-mail:momceny@163.com
-
通信作者简介
- 李玲(1973-), 女, 教授, 博士。主要研究方向:土地资源管理和资源环境。E-mail:ndliling@163.com
-
文章历史
-
收稿日期:2017-04-17
修回日期:2017-11-25
2. 河南省地质物探测绘技术有限公司, 450099, 郑州
2. Henan Geological Geophysical Surveying and Mapping Technology Co., Ltd., 450099, Zhengzhou, China
伴随着工矿业、农业等的快速发展,工业废弃物与生活垃圾的排放、农药化肥的过量施用等问题时有发生,各类污染物所携带的重金属进入土壤[1]。过量的重金属会影响土壤的理化性质[2],造成土壤结构破坏、水土流失等问题,且会迁移到动植物以及人体内,进而对生态安全和人类健康产生危害[3],严重影响人类的生存与发展。
近来,土壤的重金属污染逐渐被国内外所重视[4-9]。科学、合理、准确地评估可为制订有效的污染防治提供依据。单因子指数法、内梅罗指数法、生态风险系数法等是较为常见的污染评估方法[10-15],其中内梅罗指数法运用较为广泛。复合指数法评价结果与内梅罗指数法的结果在空间位置和污染等级方面存在着一定的差异。笔者采用2016年采样数据,遴选Cd、Pb、As、Hg、Cr作为特征污染元素,借助ArcGIS软件,分别用内梅罗指数法和复合指数法进行评估。对这2种方法所得出结果的差异进行比对,并分析存在差异的原因,以期为今后的土壤重金属风险评估工作提供参考。
1 研究区概况该区地处豫、陕、晋的交界地带,位于黄河中游地区,当地年均日照时间2 261.7 h,年均气温13.8 ℃,年均降水量580~680 mm,全年无霜期216 d,属温带半干旱大陆性季风气候。研究区面积1万6 966 hm2,其中耕地7 219 hm2,园地9 595 hm2,其他用地152 hm2。土壤类型以褐土为主,作物熟制一年二熟或者两年三熟制。
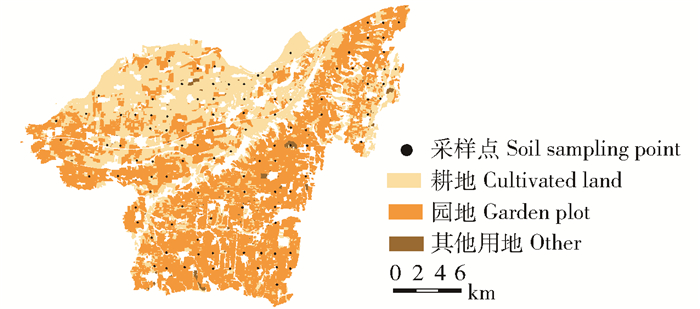
2 材料与方法 2.1 样点采集和测定通过GPS定位,大致按1 km×1 km网格进行布点,采用五点取样法采样,采样深度20 cm。
|
图 1 土壤样点分布图 Figure 1 Soil sampling points in the study area |
土壤pH值测定采用电位法。Pb、Cd采用GB/T 17141—1997《土壤质量铅、镉的测定石墨炉原子吸收分光光度法》测定,As、Hg采用HJ/T 680—2013《土壤和沉积物汞、砷、硒、铋、锑的测定微波消解/原子荧光法》测定,Cr采用HJ/T 491—2009《土壤总铬的测定火焰原子吸收分光光度法》测定。
2.2 评价方法内梅罗指数法及复合指数法均需要以单因子指数作为评价因子,因此需要先确定单因子指数。
| $ {{\mathit{P}}_{\mathit{i}}}=\frac{{{\mathit{C}}_{\mathit{i}}}}{{{\mathit{S}}_{\mathit{i}}}}。$ | (1) |
式中:Pi为单因子指数;Ci为元素i的实测值,smg/kg;Si为元素i的标准值,mg/kg。若Pi≥1,则存在污染;若Pi<1,则不存在污染。标准值遵照 15618—1995《土壤环境质量标准》中的二级标准确定。
2.2.1 内梅罗指数法该方法能够较为全面地反映研究区各重金属对土壤的综合危害程度。
| $ {{\mathit{P}}_{\text{N}}}=\sqrt{\frac{\mathit{P}_{\mathit{i}\text{max}}^{2}+\mathit{P}_{\mathit{i}\text{ave}}^{2}}{2}}。$ | (2) |
式中:PN为内梅罗指数;Pi为单因子指数;Pimax为各重金属元素单因子指数的最大值;Piave为各重金属元素单因子指数的平均值。PN分级标准如表 1[16]所示。
| 表 1 内梅罗指数法污染程度分级 Table 1 Classification of pollution degree by Nemerow Index Method |
该法是将各元素的Pi进行空间插值、赋值(Ki)、叠加,获取各图斑复合污染状况。复合指数法可获取2类信息:1)复合污染种类指数(Pollution Compound Type Index,Pcti),确定图斑受到哪几种元素的污染;2)复合污染等级指数(Pollution Compound Level Index,Pcli),为单因子指数的最大值;引用表 1分级标准。
若Pi<1,则Ki=0;
若Pi≥1,则Ki=1,
| $ {{\mathit{P}}_{\text{cti}}}=\sum\limits_{\mathit{i}=1}^{\mathit{n}}{{{\mathit{K}}_{\mathit{i}}}}。$ | (3) |
式中:Pi为单因子指数;Ki为污染情况赋值;Pcti为复合种类指数。若Pi<1时,则土壤未受到污染,计Ki为0,此时复合种类指数为0;若Pi≥1时,则土壤存在污染,计Ki为1,K值之和即为其复合种类指数。
| $ {{\mathit{P}}_{\text{cli}}}={{\mathit{P}}_{\mathit{i}\text{max}}}。$ | (4) |
式中:Pcli为复合等级指数;Pimax为各重金属元素单因子指数的最大值。对单因子指数进行筛选,得到单因子指数的最大值,将最大值按照表 1进行分级处理,即为复合污染等级。
3 结果与分析共采集108个样点,计算样点各元素的单因子指数值,结果如表 2所示。
| 表 2 研究区重金属元素单因子指数 Table 2 Single factor index of heavy metals in the study area |
Cd、Pb、As、Hg、Cr的含量有较大的差异, Cd、Pb、As、Hg的变异系数比较大,表明这4种元素的空间变化比较大。Cd、Pb、As、Hg等元素的单因子指数最大值均>1。
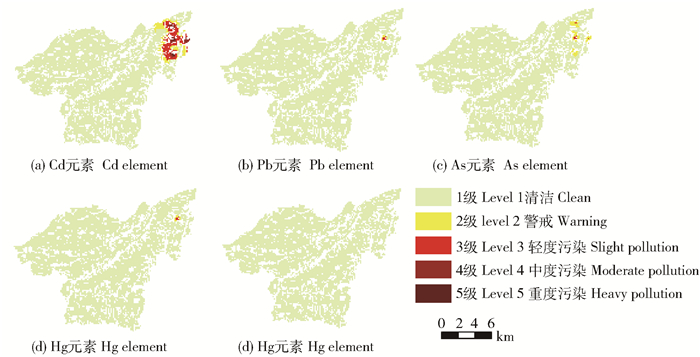
在ArcGIS中运用反距离加权法对单因子指数进行插值并导出栅格文件,将栅格在ArcGIS中进行分区统计,从而得到每一个图斑的各单因子指数。结果如图 2所示。
|
图 2 基于单因子指数的土壤重金属污染空间分布 Figure 2 Spatial variation of heavy metals soil pollution based on single factor index |
Cd、Pb、As、Hg 4种元素存在污染区域,其中Cd污染面积644.74 hm2,Pb、Hg污染面积10.53 hm2,As污染面积18.45 hm2。总的来看,污染存在于研究区的东北部,存在复合污染情况。
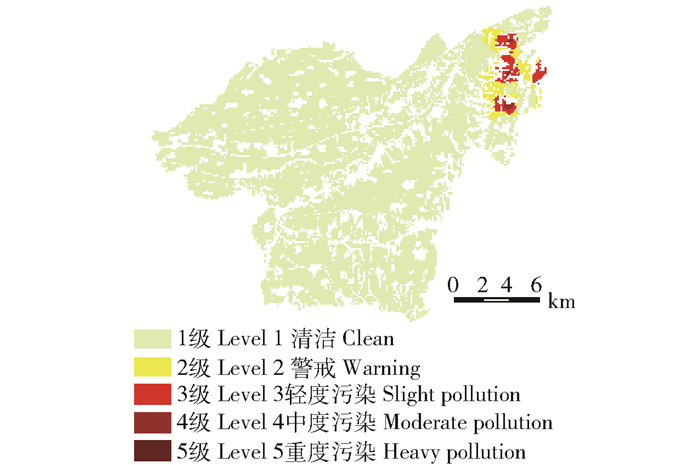
3.1 内梅罗指数评价结果根据单因子指数,计算其内梅罗指数,如图 3所示。研究区3级以上区域总面积为317.70 hm2,占研究区的1.87%。其中:3级区域为292.87 hm2,占污染区域的92.19%,占研究区的1.73%;4级区域为24.82 hm2,占污染区域的7.81%,占研究区的0.15%。污染区域集中于研究区的东北部。
|
图 3 基于内梅罗指数的土壤重金属污染空间分布 Figure 3 Spatial variation of heavy metals soil pollution based on Nemerow index |
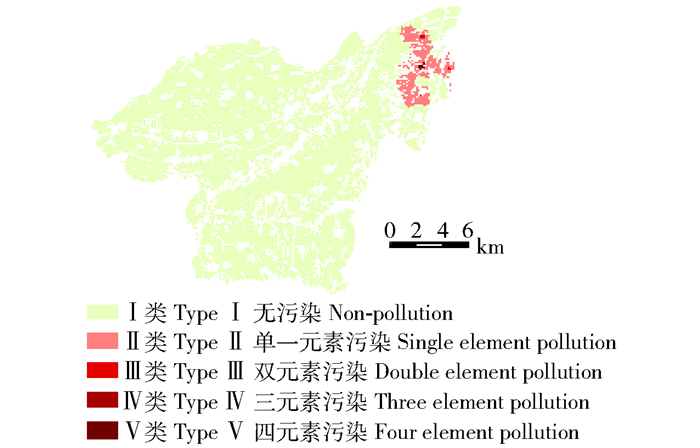
根据单因子指数进行叠加得到复合种类指数,如图 4所示。其中:Ⅱ类区域为626.29 hm2,占污染区域的97.14%,占研究区的3.69%;Ⅲ类区域为7.92 hm2,占污染区域的1.23%,占研究区的0.05%;Ⅴ类区域为10.53 hm2,占污染区域的1.63%,占研究区的0.06%。
|
图 4 基于复合种类指数的土壤重金属污染空间分布图 Figure 4 Spatial variation of heavy metals soil pollution based on compound type index |
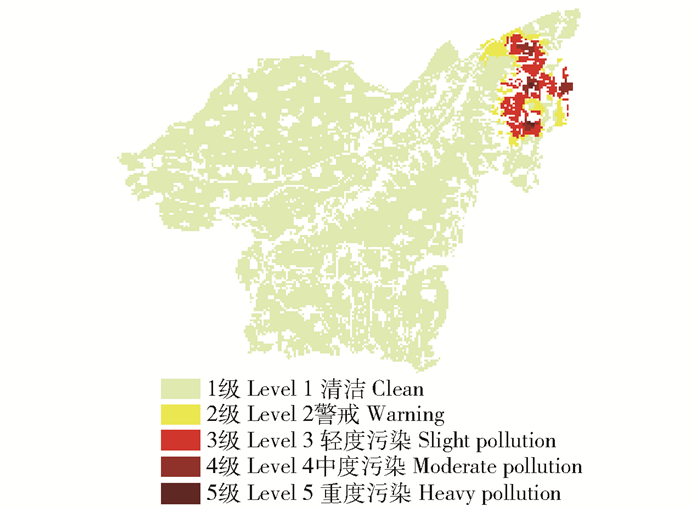
将单因子指数法的处理结果进行空间叠加,根据表 1统计出复合等级指数,如图 5所示。研究区内3级以上区域为644.74 hm2,占研究区的3.80%。其中:3级区域为494.74 hm2,占污染区域面积的76.73%,占研究区的2.92%;4级区域为138.71 hm2,占污染区域面积的21.51%,占研究区的0.82%;5级区域为11.30 hm2,占污染区域面积的1.75%,占研究区的0.07%。
|
图 5 基于复合等级指数的土壤重金属污染空间分布图 Figure 5 Spatial variation of heavy metals soil pollution based on compound level index |
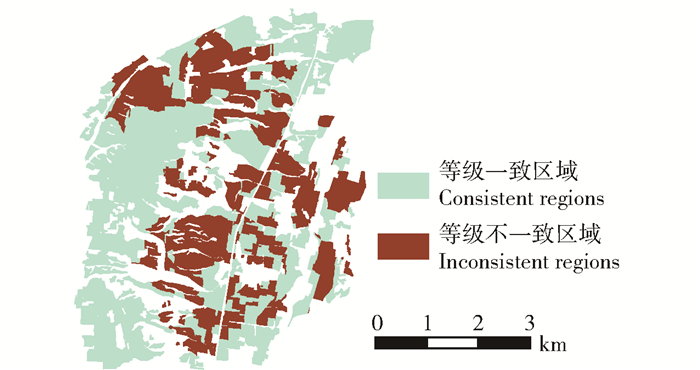
将每一图斑的内梅罗指数减其复合等级指数,若其结果不为0,则说明2种方法的评级存在不一致。经计算发现有739.12 hm2的计算结果为-1,说明这部分区域的内梅罗指数比其复合等级指数低一个等级。由图 3和图 5可知,等级发生变化的区域为研究区的东北部,所以将该区域剪裁出来(图 6)。
|
图 6 评级不一致区域空间分布图 Figure 6 Spatial variation of inconsistent regions |
将上述方法评价结果中等级不一致的区域进行统计,如表 3所示。
| 表 3 2种方法评级不一致区域面积 Table 3 Areas of the inconsistent regions by the two methods |
内梅罗1级区域有275.59 hm2与复合指数2级区域重合,占研究区的1.62%;内梅罗2级区域为327.05 hm2与复合指数3级区域相重合,占研究区的1.93%;内梅罗3级区域为125.18 hm2与复合指数4级区域相重合,占研究区的0.74%;内梅罗4级区域为11.30 hm2与复合指数5级区域相重合,占研究区的0.07%。在EXCEL中利用随机函数从等级不一致区域选取特征图斑,如表 4所示。
| 表 4 2种方法评级不一致区域抽取图斑 Table 4 Extracted spots of the inconsistent regions by the two methods |
图斑b、c、d的内梅罗指数评级低于复合等级指数评级,其原因是:第一,从计算过程来看,由式2可知,单因子指数最大值≥内梅罗指数值,由式4可知,复合等级指数=单因子指数最大值,则复合等级指数≥内梅罗指数;第二,从数据的分布特点来看,当单因子指数最大值普遍较大,且处于分级标准的临界值附近;但其他指数值均比较小,造成平均值大大低于最大值,基本处于最大值的1/2附近。如表 4中的图斑b, 其Cd指数为1.038,属于轻度污染,其他元素单因子指数均小于0.7,属于清洁。若使用复合指数法时,该图斑的等级指数为1.038,为轻度污染,但使用内梅罗指数法时,其指数仅为0.811,等级为警戒,其结果降低了污染指数,掩盖了图斑b存在轻度污染的事实。正是由于以上原因,造成研究区内梅罗指数全面降低,其污染等级也随之降低,最终使其判定的污染面积小于复合指数法判定的污染面积。
4 结论通过内梅罗指数法和复合指数法评价研究区的土壤重金属污染情况的对比分析,可以看出2种方法的评价结果在空间位置和污染等级等方面存在着一定差异。
内梅罗指数法选取研究区内各元素的平均值和最大值作为变量进行评价,考虑了研究区内污染最为严重的单项污染元素对整个区域的影响;但是相较于复合指数法,内梅罗指数法在处理过程中会降低其指数值。加之局部区域数据分布的特点,当单因子指数最大值普遍较大,且处于分级标准的临界值附近,但指数平均值大大低于最大值时,会造成内梅罗指数法降低其污染等级,减少受污染区域的面积。这就导致研究区的实际受污染状况与评价预测结果之间的矛盾。
复合指数法以单因子指数法为基础,通过对研究区单因子法的计算结果进行空间叠加,通过统计分析,可以得到复合种类指数和复合等级指数。其中,复合种类指数解决了存在污染的元素有几种和是哪几种的问题,这是内梅罗指数法无法直接反映的内容;而复合等级指数客观反映了污染程度。笔者认为复合指数法方法不会因为评价过程本身的问题和数据的分布情况对结果产生影响,其适用范围广泛,所得到的结果能够更科学的反映研究区的真实状况,其结果更为客观和完善,且操作也较为简便。
土壤重金属污染是阻碍土地资源可持续利用的一个重要问题,对污染状况进行评价十分必要。更为客观真实的土壤重金属污染评价方法更有利于了解和掌握土壤实际状况,为合理科学的利用土地资源奠定良好的基础。在确定复合污染区域的位置、面积及复合污染物的种类等工作中,复合指数法相较于内梅罗指数法具有较为明显的优势,可以为土地利用者和决策者提供更为真实客观的评价结果,应在今后的土壤重金属风险评估工作中加以推广和使用。
| [1] |
何东明, 王晓飞, 陈丽君, 等. 基于地积累指数法和潜在生态风险指数法评价广西某蔗田土壤重金属污染[J].
农业资源与环境学报, 2014, 31(2): 126.
HE Dongming, WANG Xiaofei, CHEN Lijun, et al. Assessment on heavy metals contaminations of sugarcane soil in Guangxi Province by the geo-accumulation index and potential ecological risk index[J]. Journal of Agricultural Resources and Environment, 2014, 31(2): 126. |
| [2] |
姜理英, 杨肖娥, 叶海波, 等. 炼铜厂对周边土壤和作物体内重金属含量及其空间分布的影响[J].
浙江大学学报(农业与生命科学版), 2002, 28(6): 690.
JIANG Liying, YANG Xiaoe, YE Haibo, et al. Effect of copper refining on spatial distribution of heavy metal in surrounding soils and crops[J]. Journal of Zhejiang University (Agric. & Life Sci.), 2002, 28(6): 690. |
| [3] |
马剑宇, 赵佐平, 闵锁田. 不同土壤重金属污染评价方法对比研究[J].
现代农业科技, 2016(13): 223.
MA Jianyu, ZHAO Zuoping, MIN Suotian. Comparative study of different soil heavy metal pollution evaluation method[J]. Modern Agricultural Science and Technology, 2016(13): 223. DOI: 10.3969/j.issn.1007-5739.2016.13.139. |
| [4] |
赵小学, 姚东平, 成永霞, 等. 铅冶炼区土壤重金属总量和有效态含量的函数分析[J].
中国环境监测, 2017, 33(1): 68.
ZHAO Xiaoxue, YAO Dongping, CHENG Yongxia, et al. Function analysis on the total and available contents of heavy metal in soils of a lead smelting area[J]. Environmental Monitoring in China, 2017, 33(1): 68. |
| [5] |
周卫红, 张静静, 邹萌萌, 等. 土壤重金属有效态含量检测与监测现状、问题及展望[J].
中国生态农业学报, 2017, 25(4): 605.
ZHOU Weihong, ZHANG Jingjing, ZOU Mengmeng, et al. The detection and monitoring of available heavy metal content in soil:A review Chinese[J]. Journal of Eco-Agriculture, 2017, 25(4): 605. |
| [6] |
李小曼, 刘勤, 徐梦洁, 等. 苏南村镇土壤重金属空间变异性研究[J].
土壤通报, 2016, 47(1): 180.
LI Xiaoman, LIU Qin, XU Mengjie, et al. Spatial variability of heavy metal contents in towns of Southern Jiangsu Province[J]. Chinese Journal of Soil Science, 2016, 47(1): 180. |
| [7] |
白承荣. 乐安河洪泛区重金属分布特征及风险评价[D]. 南昌: 南昌工程学院, 2015: 5.
BAI Chengyong. Distrubution characteristics and risk assessment of heavy metals in the flooded area of Lean River[D]. Nanchang: Nanchang Institute of technology, 2015: 5. http://cdmd.cnki.com.cn/Article/CDMD-11319-1015566657.htm |
| [8] |
YILMAZ S, SADIKOGLU M. Study of heavy metal pollution in seawater of Kepezharbor of Canakkale (Turkey)[J].
Environmental Monitoring & Assessment, 2011, 173(1/2/3/4): 899.
|
| [9] |
ODIGI M I, UKREN L O, NWANKWOALA H O. Distribution of heavy metals in soils of Port Harcourt and its environs, Niger Delta, Nigeria[J].
Chinese Journal of Geochemistry, 2011, 30(4): 415.
DOI: 10.1007/s11631-011-0527-1. |
| [10] |
赵保卫, 王刚. 白银市郊区农田土壤重金属污染初步调查与评价[J].
环境科学与技术, 2010, 33(11): 79.
ZHAO Baowei, WANG Gang. Preliminary investigation and assessment of farmland soils contaminated by heavy metal around Baiyin City[J]. Environmental Science & Technology, 2010, 33(11): 79. |
| [11] |
高军侠, 党宏斌, 郑敏, 等. 郑州市郊农田土壤重金属污染评价[J].
中国农学通报, 2013, 29(21): 116.
GAO Junxia, DANG Hongbin, ZHENG Min, et al. Heavy metal pollution assessment of farmland soil in suburb in Zhengzhou City[J]. Chinese Agricultural Science Bulletin, 2013, 29(21): 116. DOI: 10.11924/j.issn.1000-6850.2012-3539. |
| [12] |
孔凡彬, 刘阳. 单因子指数法和内梅罗指数法在土壤环境质量评价中的比较[J].
甘肃科技, 2014, 30(3): 21.
KONG Fanbin, LIU Yang. The comparison of the single factor index method and the Nemerow Index Method in the evaluation of soil environmental quality[J]. Gansu Science and Technology, 2014, 30(3): 21. |
| [13] |
张玉莲, 闫天增. 内梅罗指数法在土壤重金属污染评价中的应用[J].
河南教育学院学报(自然科学版), 2012, 21(2): 35.
ZHANG Yulian, YAN Tianzeng. Application of Nemerow Index Method in the evaluation of soil heavy metal pollution[J]. Journal of Henan Institute of Education (Natural Science Edition), 2012, 21(2): 35. |
| [14] |
赵庆令, 李清彩, 谢江坤, 等. 应用富集系数法和地累积指数法研究济宁南部区域土壤重金属污染特征及生态风险评价[J].
岩矿测试, 2015, 34(1): 129.
ZHAO Qingling, LI Qingcai, XIE Jiangkun, et al. Characteristics of soil heavy metal pollution and its ecological risk assessment in South Jining District using methods of enrichment factor and index of geoaccumulation[J]. Rock and Mineral Analysis, 2015, 34(1): 129. |
| [15] |
张春梅. 城市土壤重金属的污染和生态风险评价[D]. 杭州: 浙江大学, 2006: 40.
ZHANG Chunmei. Heavy metals pollution and ecological risk assessment of urban soil[D]. Hangzhou: Zhejiang University, 2006: 40. http://cdmd.cnki.com.cn/article/cdmd-10335-2006085309.htm |
| [16] |
冯锦霞. 基于GIS与地统计学的土壤重金属元素空间变异分析[D]. 长沙: 中南大学, 2007: 31.
FENG Jinxia. Spatial variability analysis of soil heavy metal element on GIS and Geostatistics[D]. Changsha: Central South University, 2007: 31. http://cdmd.cnki.com.cn/Article/CDMD-10533-2007170304.htm |
 2018, Vol. 16
