NaI(Tl)探测器和HPGe探测器是常用的γ能谱测量仪。相对后者,NaI(Tl)探测器具有探测效率高、价格低廉等优点,被广泛用于环境放射性调查、核应急监测、核安全检测等方面,但其能量分辨率较后者低,尤其在复杂γ射线场中测量时能峰易重叠,增加了正确提取信息的难度。学者们对其进行了大量研究,认为通过能谱反演可以提高NaI(Tl)探测器γ能谱的分辨率,甚至可能超过HPGe探测器[1]。基于极大似然原理的γ能谱反演被认为是一种可有效提高γ能谱能量分辨率的方法[2-3]。为观察使用该方法提高能量分辨率后,分辨出的能量是否准确,采用蒙特卡罗模拟结合实验验证的方法研究了其反演γ特征峰中心道址的能力。
1 极大似然法反演γ能谱的原理γ放射性核素发射出的γ光子被探测器探测到的计数服从泊松分布,因此,可根据似然原理可写出γ能谱的似然函数:
| $ L\left( \lambda \right)=P\left( n*|\lambda \right)={{\text{e}}^{-\sum\nolimits_{i=1}^{m}{\lambda *\left( i \right)}}}\frac{\prod\nolimits_{i=1}^{m}{\lambda *{{\left( i \right)}^{n*(i)}}}}{\prod\nolimits_{i=1}^{m}{n*\left( i \right)!}} $ | (1) |
式中:n*(i)为实测能谱第i道计数,服从期望值为λ*(i)的泊松分布;λ(j)为第j种能量γ射线的计数期望值;P(j, i)为第j种能量的γ光子在能谱第i道被探测到的概率。
且由数学期望的加和性质可推导出:
| $ \begin{align} &l\left( \lambda \right)=\ln (L(\lambda )) \\ &\mathop{{}}^{{}}\mathop{{}}^{{}}=-\sum\nolimits_{i=1}^{m}{\sum\nolimits_{j=1}^{m}{\lambda \left( j \right)P\left( j, i \right)}}+ \\ &\mathop{{}}^{{}}\mathop{{}}^{{}}\quad \sum\nolimits_{i=1}^{m}{\ln \left( \frac{{{\sum\nolimits_{j=1}^{m}{\lambda \left( j \right)P(j, i)}}^{n*(i)}}}{n*\left( i \right)!} \right)} \\ \end{align} $ | (2) |
根据极大似然原理,
| $ {{\lambda }^{k+1}}\left( j \right)={{\lambda }^{k}}(j)\sum\limits_{i=1}^{m}{\frac{n*\left( i \right)P\left( j, i \right)}{\sum\limits_{{b}'=1}^{m}{{{\lambda }^{k}}\left( {{b}'} \right)P\left( {b}', i \right)}}} $ | (3) |
式中:k=0, 1, 2, 3, …,为迭代次数。迭代初始值通常使用实测能谱数据,根据迭代计算结果,绘制能量与λ(j)的对应关系散点图即得到反演后的γ能谱。
由式(3)可知,能量响应矩阵P是能谱反演的关键参数,为得到可靠结果,需要P与实测能谱尽可能一致[3]。
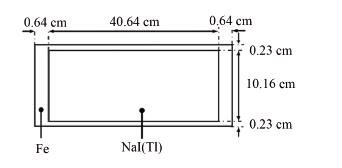
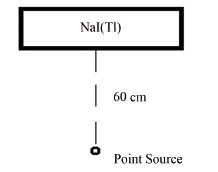
2 探测器能量响应矩阵的获取能量响应矩阵的获取方式主要有标准谱插值法[7]和MCNP (Monte Carlo N Particle Transport Code)模拟[8]。在本文的研究中,使用的是10.16 cm× 10.16 cm×40.64 cm NaI(Tl)探测器,能谱道数为1 024道,能量范围为0~3 MeV,需要使用1 024个单能γ射线的标准能谱形成该探测器的能量响应矩阵,由于实验条件限制,通过实验获取标准能谱后插值得到能量响应矩阵的方法难以实现。因此,采用蒙特卡罗模拟程序MCNP计算P,探测器几何尺寸见图 1,测量布局见图 2。
|
图 1 MCNP模拟计算所用探测器几何尺寸 Figure 1 Geometry of the detector used in the MCNP simulation |
|
图 2 MCNP模拟测量布局 Figure 2 Layout of the measurement for the MCNP simulation |
模拟计算过程中,为使模拟能谱与实测能谱的谱形近似,使用了MCNP的能谱展宽功能“GEB a b c”,需提供a、b、c的值。a、b、c与全能峰半高宽的关系[8]见式(4)。
| $ \text{FWHM}(E)=a+b\sqrt{E+c{{E}^{2}}} $ | (4) |
式中:FWHM(E)为能量为E的全能峰的半高宽,MeV,用241Am、137Cs、60Co混和点源刻度探测器后读取。根据实测谱得到的FWHM参数见表 1。
| 表 1 实验测得的NaI(Tl)探测器的半高宽 Table 1 FWHM of the 4L NaI (Tl) detector |
用最小二乘法求解a、b、c,见式(5)、式(6), 计算出a=-0.005 56,b=0.066 745 424,c=0.000 277 977。
| $ v_{i}^{2}=\text{FWHM}-(a+b\sqrt{E+c{{E}^{2}}}) $ | (5) |
| $ \left\{ \begin{align} &\frac{\sum\limits_{i=1}^{4}{v_{i}^{2}}}{\partial a}=0 \\ &\frac{\sum\limits_{i=1}^{4}{v_{i}^{2}}}{\partial b}=0 \\ &\frac{\sum\limits_{i=1}^{4}{v_{i}^{2}}}{\partial c}=0 \\ \end{align} \right. $ | (6) |
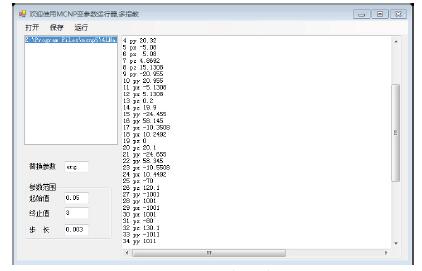
由于能谱数量多,使用C#语言编写了MCNP外壳程序,自动改变入射射线能量进行计算,程序界面见图 3。
|
图 3 MCNP外壳程序界面 Figure 3 Interface of MCNP shell |
根据模拟结果,形成10.16 cm×10.16 cm× 40.64 cm NaI(Tl)探测器在距离放射源60 cm处测量时的能量响应矩阵P。
3 γ能谱反演为观察使用极大似然法反演γ能谱特征峰中心道址的能力,使用获取的能量响应矩阵分别对模拟γ能谱和实测γ能谱进行了反演。
3.1 模拟γ能谱的反演根据图 2所示布局,使用MCNP模拟了10种能量、不同能量间隔的γ射线的标准能谱并按式(7)进行能谱叠加,使用极大似然法对叠加能谱进行反演。
| $ N(i)=\sum\limits_{j=1}^{10}{{{A}_{j}}P}(j, i) $ | (7) |
式中:N(i)为能谱第i道计数;Aj为第j种能量γ射线数,其取值见表 2。
| 表 2 式(7)中的参数值 Table 2 The value of the parameter in Formula 7 |
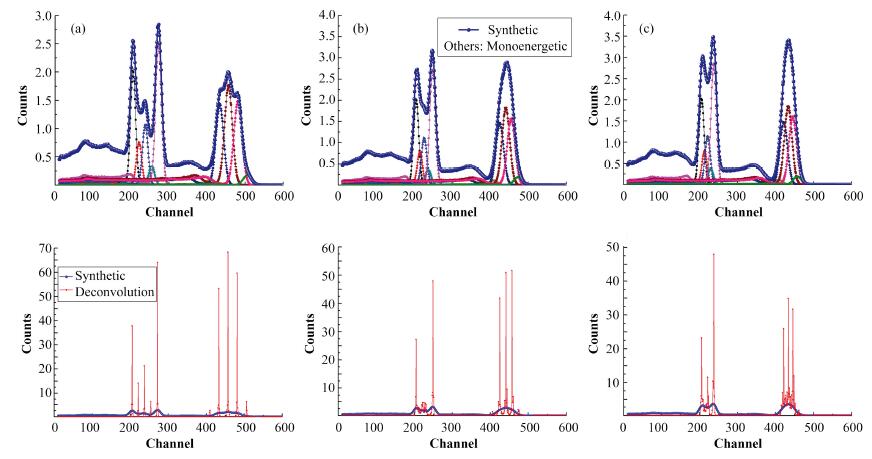
γ射线能量设置方法为:将j=1和j=6的γ射线能量分别设置为E1=0.6 MeV和E6=1.2 MeV,其他γ射线能量设置为Ej=Ej-1+nFWHMj-1。将n值设置为1、2/3、1/2,观察反演后特征峰中心道址变化情况,反演效果见图 4,特征峰中心道址变化情况见表 3。
|
图 4 γ能谱反演效果(迭代10 000次) (a) n=1,(b) n=2/3,(c) n=1/2 Figure 4 The results of γ spectra inversion (10 000 iterations) (a) n=1, (b) n=2/3, (c) n=1/2 |
| 表 3 γ能谱反演后特征峰中心道址变化情况 Table 3 The change of the central channel of the characteristic peak after the spectrum inversion |
由表 3可知,当入射γ射线的能量间隔为1倍FWHM时,本为设置的10种不同能量γ射线均能辨识,峰中心道址与参考值的最大偏差为1道;当能量间隔减小时,反演未能发现部分弱γ射线的能峰,且峰中心道址与参考值间偏差变大。
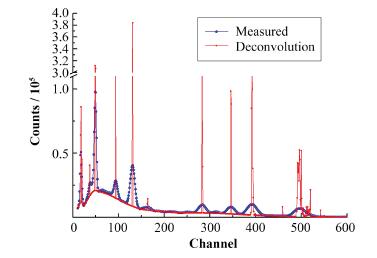
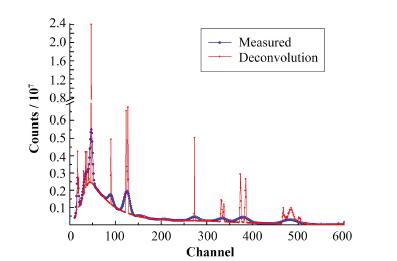
3.2 实测γ能谱的反演在一个大铅屏蔽室(外观尺寸:2.2m×1.1m× 1.8m,屏蔽室厚度15cm)中与实验室自然环境下,按照图 2所示布局,使用NaI(Tl)探测器测量152Eu标准点源的γ能谱,将实测能谱数据使用SNIP法[9]扣除本底后,用极大似然进行反演(均迭代10000次)。结果见图 5、图 6和表 4。
|
图 5 极大似然法反演铅屏蔽室中152Eu γ能谱 Figure 5 The unfolded spectra of 152Eu measured in the lead shielding room by maximum likelihood method |
|
图 6 极大似然法反演实验室自然环境中152Eu γ能谱 Figure 6 The unfolded spectra of 152Eu measured in the laboratory's natural environment by maximum likelihood method |
| 表 4 γ能谱反演后152Eu特征峰中心道址变化情况 Table 4 The change of the central channel of the characteristic peak of 152Eu after the spectrum inversion |
由图 5、图 6可见,使用极大似然法反演后,γ特征峰明显变窄,但均出现了与152Eu特征γ射线不对应的反演峰。分析认为,该现象可能与本底扣除不够理想或计算能量响应矩阵P与实际能量响应矩阵存在偏差等因素有关。
由表 4可知,反演的铅室中152Eu γ能谱,特征峰中心道址与实测值偏差小于2道;反演的实验室自然环境中152Eu能谱,特征峰中心道址与实测值偏差小于4道。
表 4中,实测谱的特征峰中心道址是通过经验认识将特征峰与152Eu发射的γ射线的能量对应后,从能谱中读出。但在实际工作中,是根据道址来确定能量。为分析能量刻度后根据特征峰中心道址计算出的能量相对特征γ射线能量参考值的偏离程度,先使用152Eu的40.12 keV、344.3 keV和1 112 keV特征峰进行能量刻度,然后将表 4中实测谱和反演谱的特征峰中心道址代入得到的刻度函数,计算对应的能量及其相对参考值的偏差见表 5。
| 表 5 特征峰中心道址的能量及相对参考值偏差 Table 5 The relative deviation between the calculated energy of the central channel of peaks and the reference value |
由表 5可知,对在铅室和实验室自然环境中测得的152Eu点源的γ能谱,根据能量刻度函数计算得到的特征峰中心道址的能量相对参考值最大偏差可达-20.7%,反演的特征峰中心能量相对参考值最大偏差可达-13.6%。且总体上,反演特征峰中心道址对应能量相对参考值的偏差大于反演前。
4 结语通过蒙特卡罗模拟程序MCNP计算了一台10.16 cm×10.16 cm×40.64 cm NaI(Tl)探测器的能量响应矩阵。使用极大似然法和获取的能量响应矩阵对包含10种不同能量γ特征峰的模拟能谱、铅屏蔽室和实验室自然环境中测得的152Eu点源的γ能谱进行了反演。对模拟能谱的反演结果显示,当γ特征峰能量间隔小于1倍FWHM时,反演后弱能峰可能消失;对实测能谱的反演结果显示,使用SNIP法扣除本底并使用模拟的能量响应矩阵进行反演,可能出现虚假特征峰。另外,从图 4~图 6的反演效果来看,特征峰反演后的计数率明显高于反演前,原因在于该反演的实质是计算入射探测器的特征γ射线数量,反演后的特征峰计数率代表单位时间入射探测器的特征γ射线数量,该值大于实测谱中全能峰计数率代表的在单位时间内特征γ射线产生全能沉积的数量。
| [1] |
Meng L J, Ramsden D. An inter-comparison of three spectral-deconvolution algorithms for gamma-ray spectroscopy[J]. IEEE Transactions on Nuclear Science, 2000, 47(4): 1329-1336. DOI:10.1109/23.872973 |
| [2] |
张庆贤.航空γ能谱特征和仪器谱解析方法研究[D].成都: 成都理工大学, 2010: 71-76. ZHANG Qingxian. The character of airborne gamma-ray spectrometry and the method for spectrum analysis[D]. Chengdu: Chengdu University of Technology, 2010: 71-76. http://cdmd.cnki.com.cn/Article/CDMD-10616-2010218361.htm |
| [3] |
Rahman M S, Cho G, Kang B S. Deconvolution of gamma-ray spectra obtained with NaI(Tl) detector in a water tank[J]. Radiation Protection Dosimetry, 2009, 135(3): 203-210. DOI:10.1093/rpd/ncp102 |
| [4] |
Shepp L A, Vardi Y. Maximum likelihood reconstruction for emission tomography[J]. IEEE Transaction on Medical Imaging, 1982, MI-1(1): 113-122. DOI:10.1109/TMI.1982.4307558 |
| [5] |
Vardi Y, Shepp L A, Kaufman L. A statistical model for positron emission tomography[J]. Journal of the American Statistical Association, 1985, 80(389): 8-20. DOI:10.2307/2288030 |
| [6] |
Lowrey J D, Biegalski S R F. Comparison of least-squares vs. maximum likelihood estimation for standard spectrum technique of β-γ coincidence spectrum analysis[J]. Nuclear Instruments and Methods in Physics Research B, 2012, 270: 116-119. DOI:10.1016/j.nimb.2011.09.005 |
| [7] |
Kiziah R R, Lowell J R. Experimental response function spanning the gamma-ray energy range of 123.6 keV to 11.67 MeV and response matrix generation for bismuth germanate scintillation detectors[J]. Nuclear Instruments and Methods in Physics Research Section A, 1991, 305: 129-142. DOI:10.1016/0168-9002(91)90526-V |
| [8] |
X-5 Monte Carlo Team. MCNP-A general Monte Carlo n-particle transport code[M]. Version 5 Volume Ⅱ: User's Guide, 2003.
|
| [9] |
Ryan C G, Clayton E, GrIffin W L, et al. SNIP, a statistics-sensitive background treatment for the quantitative analysis of pixe spectra in geoscience applications[J]. Nuclear Instruments and Methods in Physics Research B, 1988, 34: 396-402. DOI:10.1016/0168-583X(88)90063-8 |
