Mathematical Model of Relativistic Anisotropic Compact Stellar Model Admitting Linear Equation of State
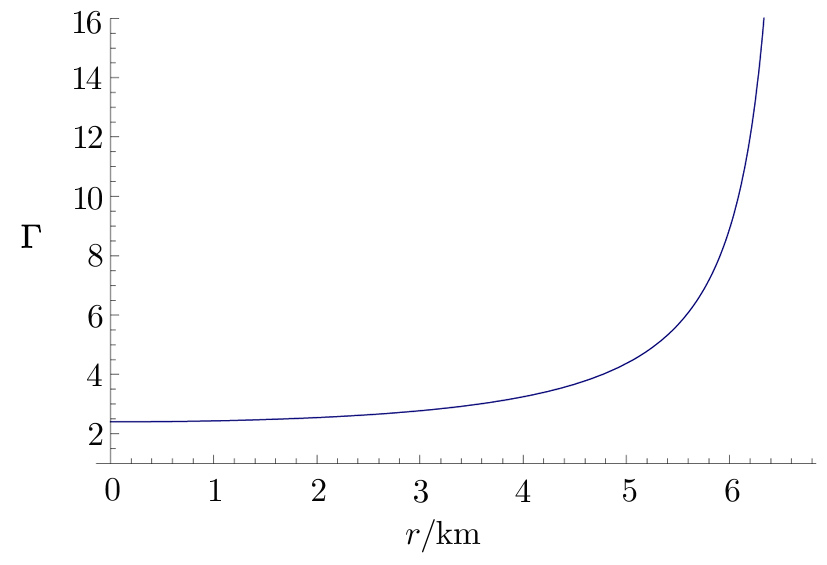
(Color online) Variation of adiabatic index Γ is plotted against r by taking the same values of the constant mentioned in Fig.
Mathematical Model of Relativistic Anisotropic Compact Stellar Model Admitting Linear Equation of State |
(Color online) Variation of adiabatic index Γ is plotted against r by taking the same values of the constant mentioned in Fig. |
| |