


Hierarchical Human Action Recognition with Self-Selection Classifiers via Skeleton Data
Cite this Article
Su Ben-Yue, Wu Huang, Sheng Min, Shen Chuan-Sheng. Hierarchical Human Action Recognition with Self-Selection Classifiers via Skeleton Data. Communications in Theoretical Physics, 2018, 70(5): 633 
Permissions
Hierarchical Human Action Recognition with Self-Selection Classifiers via Skeleton Data
† Corresponding author. E-mail:
Supported by the National Nature Science Foundation of China under Grant Nos. 11475003, 61603003, and 11471093; the Key Project of Cultivation of Leading Talents in Universities of Anhui Province under Grant No. gxfxZD2016174; Funds of Integration of Cloud Computing and Big Data; Innovation of Science and Technology of Ministry of Education of China under Grant No. 2017A09116; and Anhui Provincial Department of Education Outstanding Top-Notch Talent-Funded Project under Grant No. gxbjZD26
Abstract
Abstract
Human action recognition has become one of the most active research topics in human-computer interaction and artificial intelligence, and has attracted much attention. Here, we employ a low-cost optical sensor Kinect to capture the action information of the human skeleton. We then propose a two-level hierarchical human action recognition model with self-selection classifiers via skeleton data. Especially different optimal classifiers are selected by probability voting mechanism and 10 times 10-fold cross validation at different coarse grained levels. Extensive simulations on a well-known open dataset and results demonstrate that our proposed method is efficient in human action recognition, achieving 94.19% the average recognition rate and 95.61% the best rate.
Keyword:human action recognition;hierarchical architecture model;self-selection classifiers;optimal classification unit
1 Introduction
Human action recognition (HAR) is a hotspot of computer vision.[1] With the popularity of human centered-computing, HAR is of great importance in human-machine interaction, virtual reality, mixed reality, robotics, education, medical treatment, games, intangible cultural heritage and so on.[2] Due to individual diversity in human beings, styles of the same action performed by different persons are usually different. Because of psychological emotions, operating time and other reasons, the same action is performed even for the same person at same time, and the results may also be different.[3] Therefore, it is a huge challenge for HAR to deal with the complexity and variety of human actions. The study of HAR can be traced back to the early work of Johansson.[4] Experiments showed that most of the action can be direct recognized according to the position information of the joint, and the change of the human skeleton position can reflect the information of action. Many of the early research work were based on MoCap,[5–6] namely motion capture, a system of recording the movement of objects or people. However, MoCap needs to manually mark the position of joint point and thus is high-cost.
Subsequently, Kinect a simple and low-cost device, has been paid much attention. Kinect released by Microsoft was originally used as a peripheral to the Microsoft Xbox gaming console to enhance the gaming experience. However, its excellent product experience and advanced somatosensory technology have attracted the interest of academics, and more and more scholars use its technology for research activities. HAR is an important topic of these activities. Recently, research works on Kinect-based human motion recognition have made great progress. Firstly, Li et al.[7] proposed a Bag-of-3D-Point human motion recognition algorithm. Yang et al.[8] developed a fast HAR algorithm based on skeleton data. A compact human pose representation based on Histograms of 3D Joint Locations (HOJ3D) was reported by Xia et al.[9] Afterwards, Ellis et al.[10] extracted time series of human gestures from skeleton sequences for action recognition, which includes each posture and the whole motion information. Very recently, Shahroudy et al. introduced a large-scale dataset (NTU RGB+D) for HAR,[1] and put forward a Part-aware Long Short-Term Memory (P-LSTM) model, which is more effective than the traditional recurrent neural network. Similarly, an end-to-end two-stream recurrent neural network method was proposed by Wang et al.[2] Other methods, such as Refs. [13–15] are also used to study the position information of the skeleton joint points for HAR. However, the data acquired by Kinect is low quality and high noise, since Kinect uses structured light coding technology to acquire the depth data of the image,[16–17] which makes the skeleton data drift. Therefore, it is another huge challenge for HAR using skeleton data.
To overcome the above two challenges, on the one hand, we propose a hierarchical human motion recognition model to coarse grain actions, classifying human actions layer-by-layer, and each layer adopts different kinds of data features with or without time-varying. On the other hand, we design an optimal classification unit by selecting the best classifier based on the training data itself to enhance the recognition rate.
The rest of the paper is organized as follows: We analyze human body structure stratification and propose hierarchical recognition strategy in the next section. In Sec.
2 Hierarchical Architecture
2.1 Human Body Structure Stratification
Human body is a complex system, consisting of nine subsystems, where the human body movement system is an important one. The exercise system consists of three organs: bone, bone connection, and skeletal muscle. Bones are connected in different shapes to form the skeleton to make up the basic frame of the human body. The bone connection, so-called the joint, is a locomotion axis. The skeletal muscle provides power for motion. From the point of view of human movement, bone is passive, while skeletal muscle is active. As a result, the physical information of passive motion and the active EMG signal are main factors in the field of HAR. In the field of computer vision, optical sensors are generally used to acquire the physical information of motion. In common sense, the basic posture of the human body is usually composed of the head, neck, chest, abdomen and limbs.
Human movement can be generally divided into translation, rotation, and compound movement. However, the movement and structure of the human body are dependent. In the following, we will stratify the structure of the human body. The first layer is a whole, and the second layer has five parts. Accordingly, we also separate the human body movement into two layers, corresponding to the whole body movement and the sectional movement respectively. Thus, the structure of human motion system exhibits hierarchical behavior, playing a guiding rule in HAR.
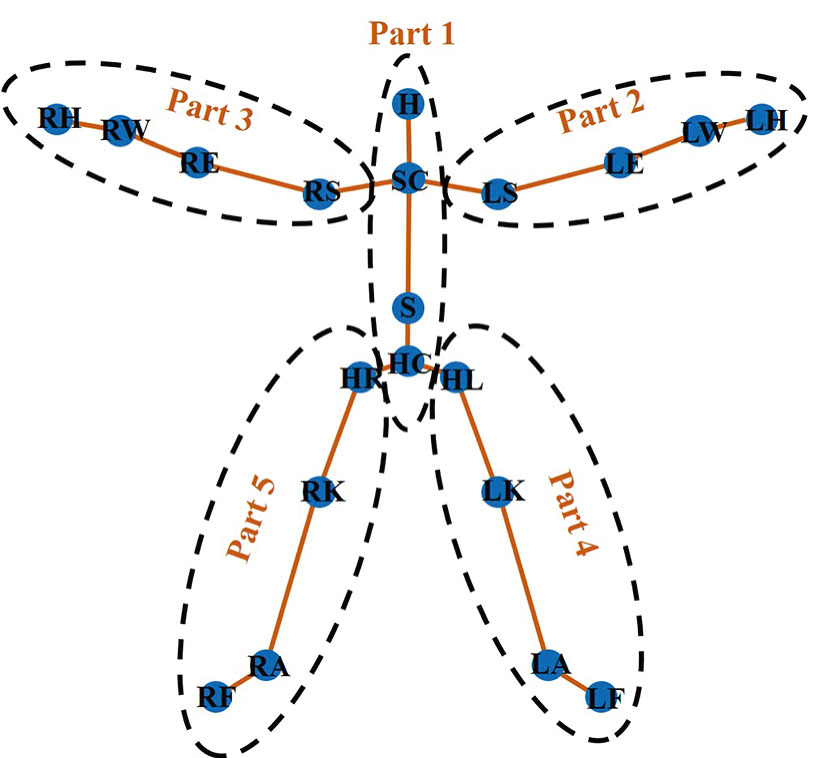
Kinect skeleton tracking technology uses 20 human skeleton joint points to represent a human model. These 20 points are as follows: HipCenter (HC), Spine (S), Shoulder Center (SC), Head (H), Left Shoulder (LS), Left Elbow (LE), Left Wrist (LW), Left Hand (LH), Right Shoulder (RS), Right Elbow (RE), Right Wrist (RW), Right Hand (RH), HipLeft (HL), Left Knee (LK), Left Ankle (LA), Left Foot (LF), HipRight (HR), Right Knee (RK), Right Ankle (RA), and Right Foot (RF). Based on the Kinect skeleton model, we split human body into five parts, and draw its schematic illustration in Fig.
 | Fig. 1 (Color online) Kinect human model and 5 parts, where Part 1 includes HC, S, SC, and H; Part 2 includes LS, LE, LW, and LH; Part 3 includes RS, RE, RW, and RH; Part 4 includes HL, LK, LA, and LF; Part 5 includes HR, RK, RA, and RF. |
2.2 Hierarchical Recognition Strategy
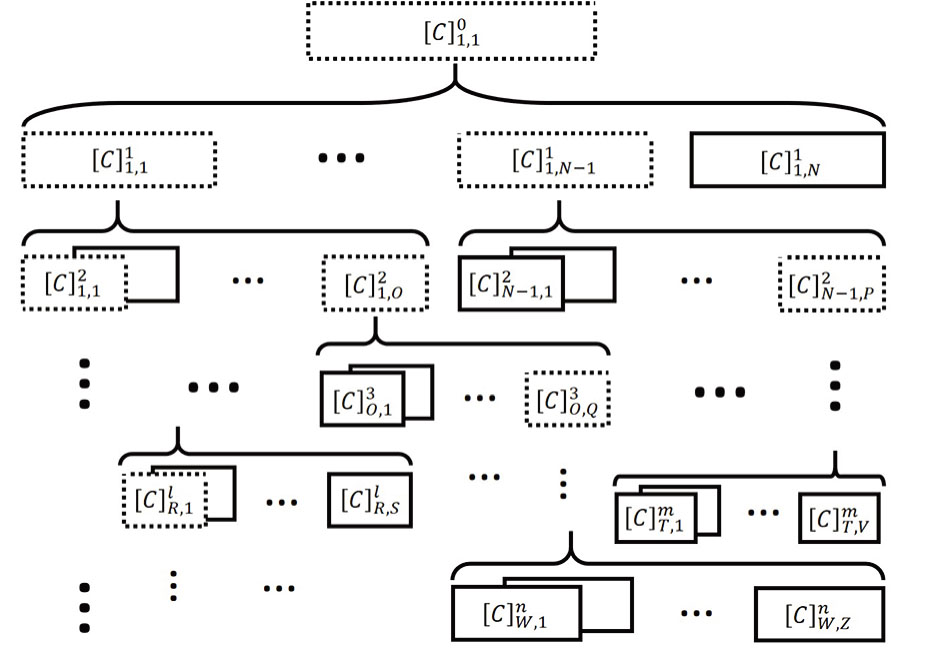
According to the human body structure stratification, we propose a hierarchical strategy, which simplifies the complex human body behavior by classifying different kinds of action. Our proposed hierarchical strategy is described in Fig. 

 | Fig. 2 Hierarchical classification strategy, where  |
Next, we take the following actions, as examples such as waving with right hand, punching with right hand, waving with both hands and punching with both hands, and use two-level classification method to apply our strategy. Firstly, waving with right hand and punching with right hand are coarse-grained as one kind of movement, e.g. actions-with-right-arm, and waving with both hands and punching with both hands are regarded as another kind, e.g. actions-with-both-arms. Secondly, we further classify these two kinds of movement into more visible actions. Note that here the detailed actions of fingers are not considered.
3 Self-Selection Classifiers
3.1 Optimal Classification Unit
The general process of HAR is shown in Fig.
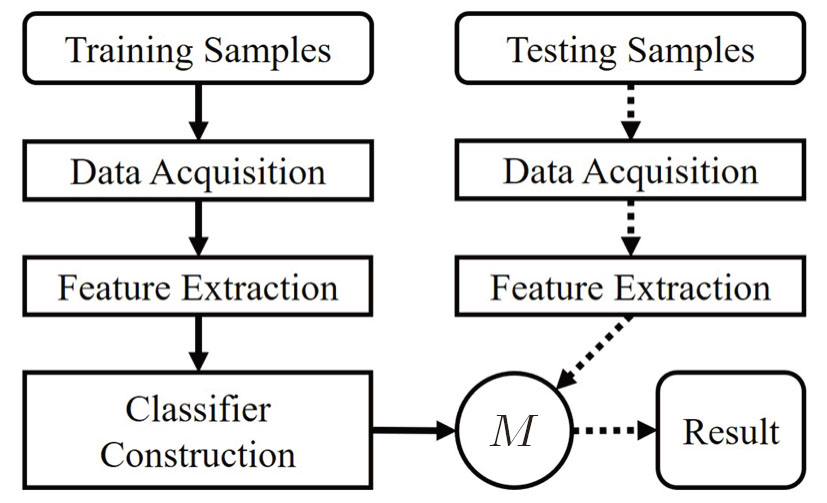 | Fig. 3 General process of HAR. M denotes the model learned through training samples. |
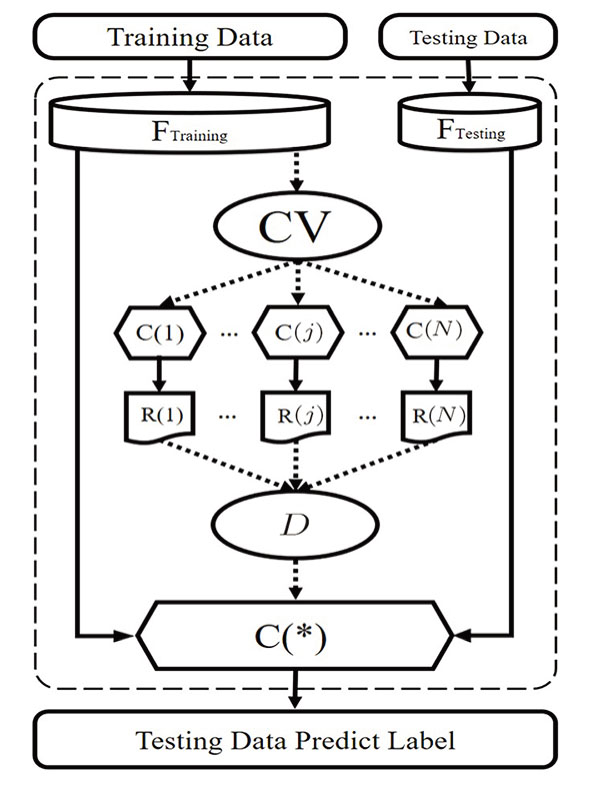
Traditionally, the classifier construction depends on one’s sufficient prior knowledge or experience. It is thus difficult to design an adaptive classifier, which can perform better identification automatically. In this article, we design an optimal classification unit (OCU), as shown in Fig. Giving training data with labels; Designing a set of classifiers {C(1),C(2),…,C(N)}; Inputting the training data to each classifier by cross-validation, and outputting a recognition rate matrix; Selecting an optimal classifier C(*) by the voting mechanism (refer for details to the Subsec. Testing C(*) and outputting the final predict labels.
 | Fig. 4 Schematic illustration of construction of OCU. FTraining and FTesting represent the feature of training data and testing data, respectively. CV denotes the cross-validation method for determining the best classifier, C(1), C(2),C(j), and C(N) denote classifiers, R(1), R(2), R(j), and R(N) denote the recognition results by different classifiers, D is probability voting mechanism for decision-making, and C(*) indicates the optimal classifier. |
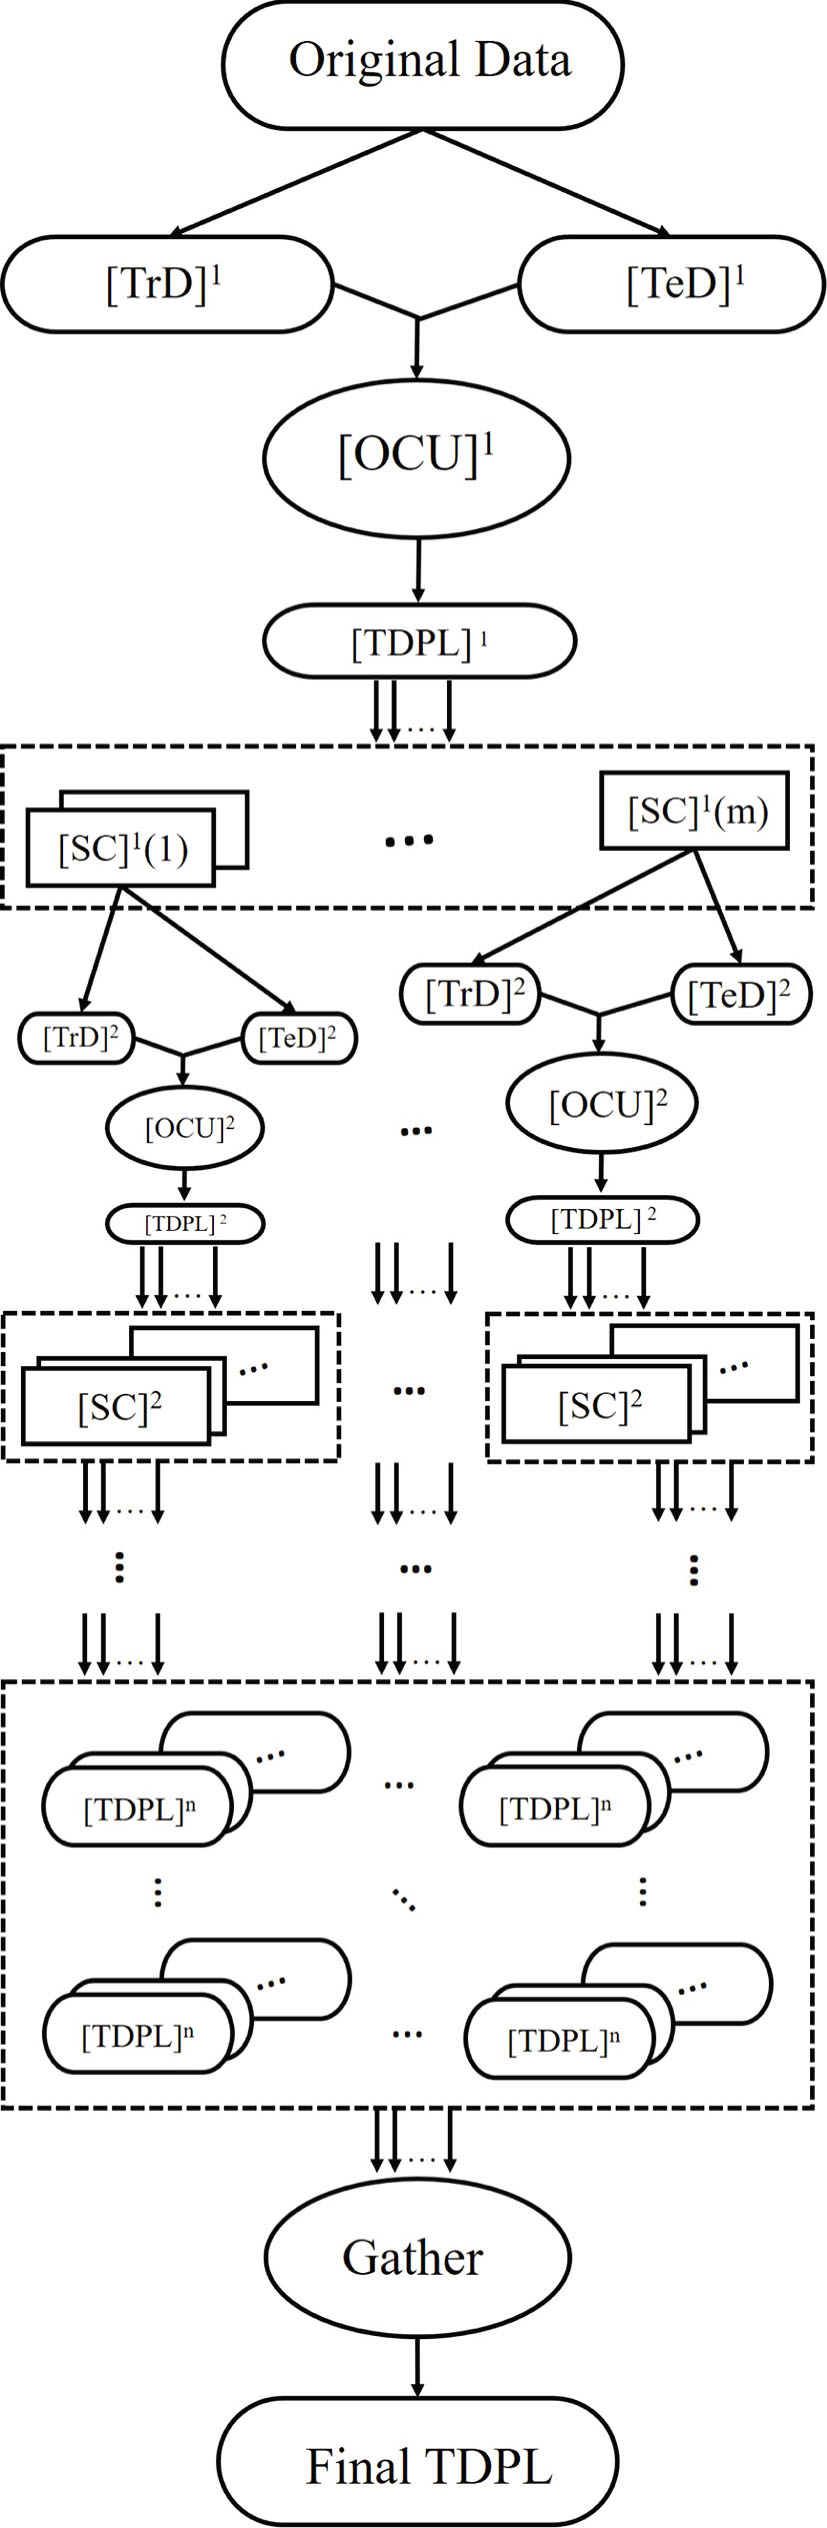
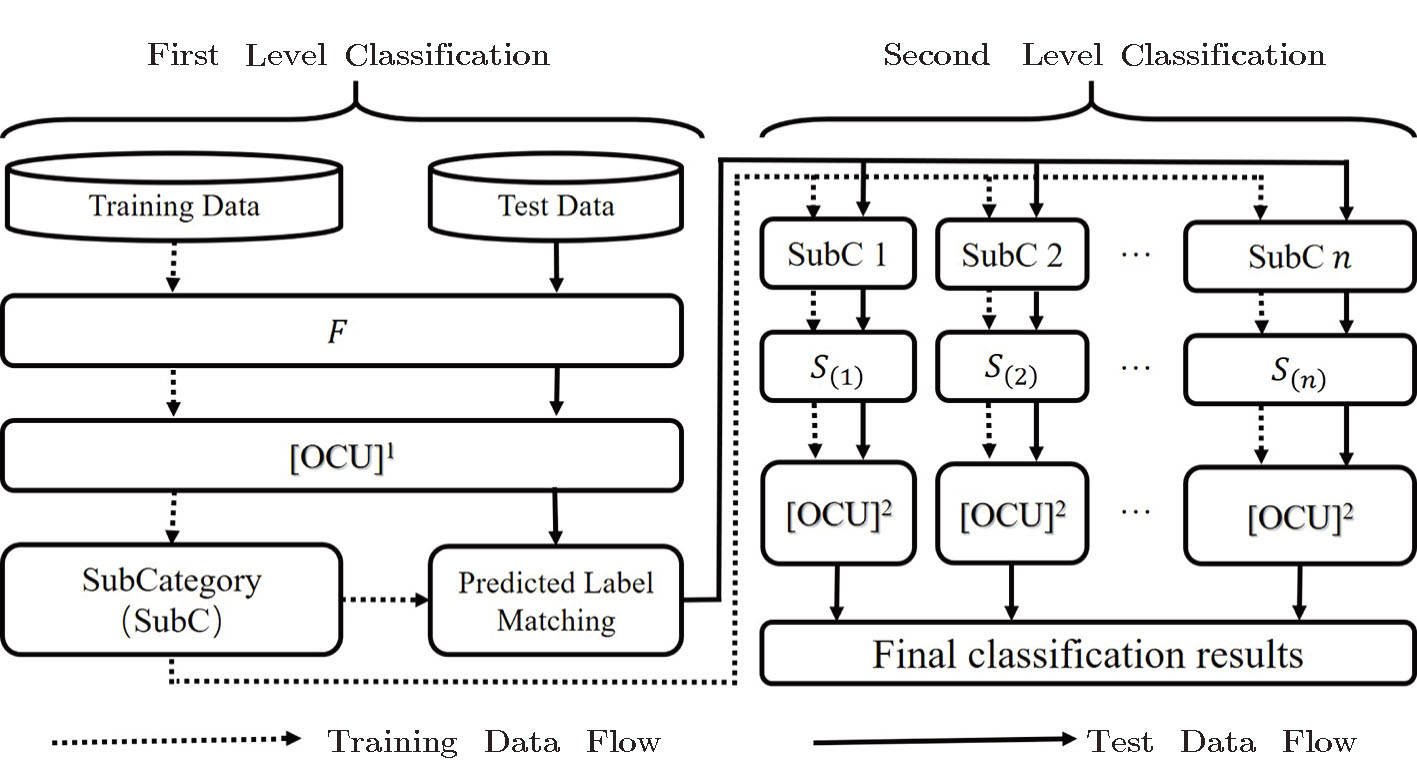
Furthermore, OCU is also suitable for hierarchical classification. The use of OCU in deep hierarchical classification model is shown in Fig.
 | Fig. 5 OCU in deep hierarchical classification model. TrD, TeD, TDPL, and SC are the abbreviation of Training Data, Testing Data, Testing Data Predict Label, and Sub-Category, respectively. The superscript of the symbol “[]n” represents the index of layers. m indicates the number of categories in the local layer. |
3.2 Probability Voting Mechanism
We start from a recognition rate matrix N × M, where the row number 1,2, …, N represent the index of classifier, and M denotes m-fold cross-validation, and the voting mechanism of the optimal classifier is shown in Fig.
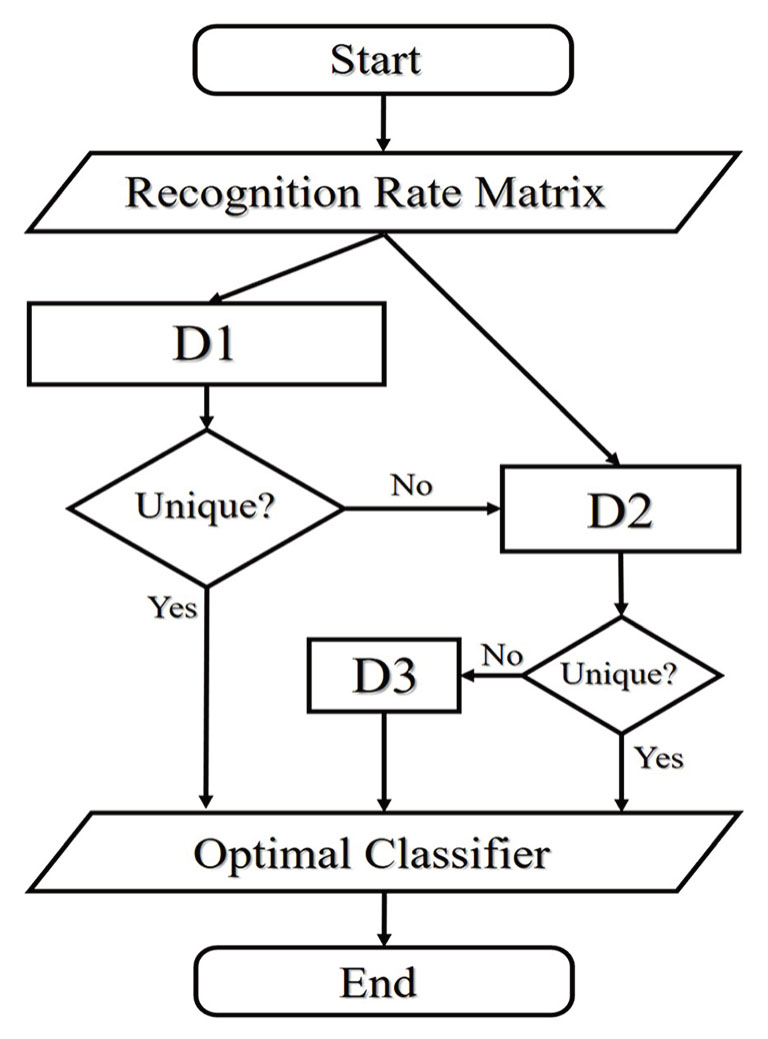 | Fig. 6 The voting mechanism of OCU. Step D1 is to obtain the probability of each classifier having maximal recognition rate in M tests, and outputs the index of the classifier with maximal probability, D2 calculates the average rate over M trials of the classifiers offered by D1, and outputs the index of the classifier with maximal average rate, and D3 randomly chooses a classifier given by D2. |
4 Simulation
4.1 Environment
In this study, the simulation environment includes hardware and software. We use the hardware setup: Intel(R) Core(TM) i5-7500 CPU @ 3.40GHz 3.41GHz, 8.00GB RAM(7.90GB usable), and the software setup: Windows 10 64-bit operating system and MATLAB R2017b.
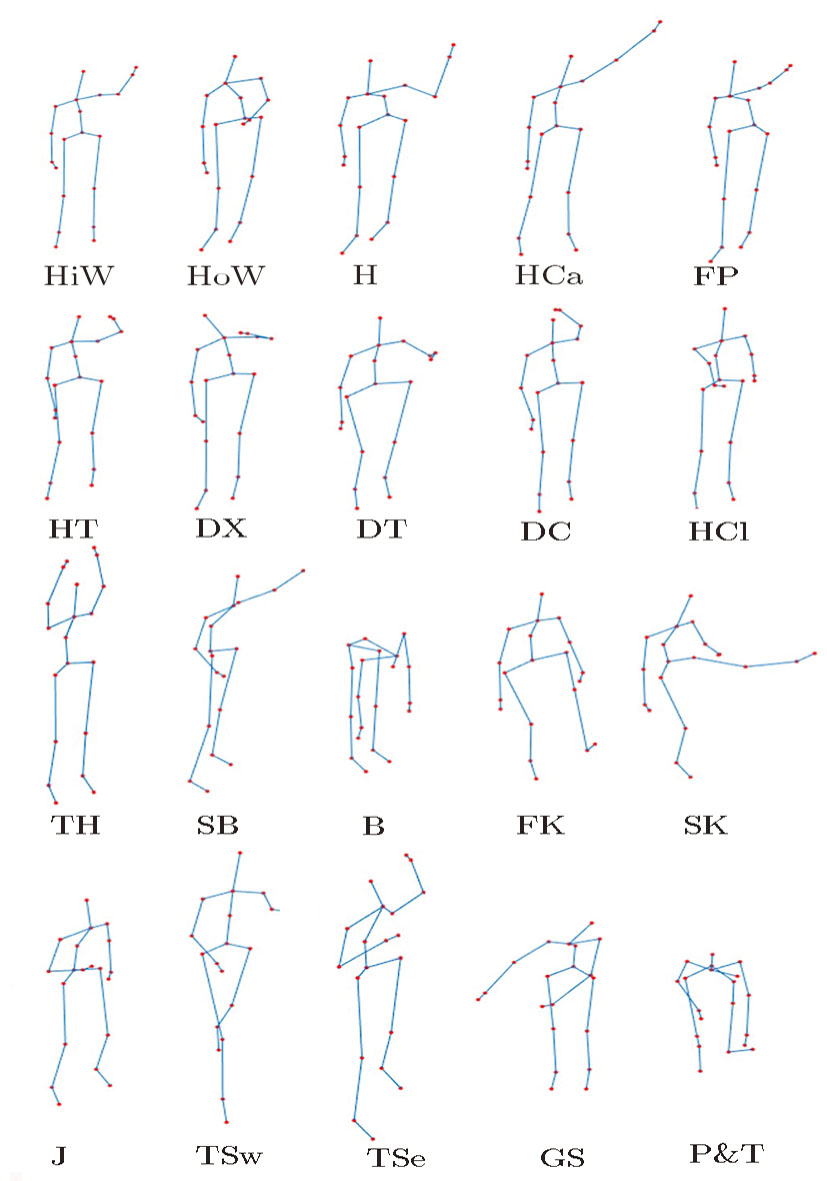
We take the public dataset MSRAction3D (MSRAction3D Skeleton Real3D). There are 20 action types in this dataset, as shown in Fig.
 | Fig. 7 Actions in MSRAction3D dataset, high arm wave (HiW), horizontal arm wave (HoW), hammer (H), hand catch (HCa), forward punch (FP), high throw (HT), draw x (DX), draw tick (DT), draw circle (DC), hand clap (HCl), two hand wave (TH), side-boxing (SB), bend (B), forward kick (FK), side kick (SK), jogging (J), tennis swing (TSw), tennis serve (TSe), golf swing (GS) and pick up & throw (P&T). |
4.2 Process


5 ) denote that a ⊕ b : = a or b or (a,b), and a | b : = a or b respectively.
(i) Feature Extraction
Firstly, we divide the original actions into two-level categories, and each level includes seven kinds of actions, as shown in Table 
| Table 1 Each level classification target on MSRAction3D. The abbreviations are the same as Fig. |
Analogously, we can get M(yi), M(zi), and D(yi), D(zi). The features of the first-level classification are thus described by the following vector


Therefore, the characteristics
(ii) Classifier Construction
Human action can be recognized as a typical time-series signal, in which there is a strong correlation between the adjacent frames. Therefore, it is essential for HAR to analyze the change of the action trajectory of the joint points in both time and space. By using different classifiers we classify the data into two types according to their features. One is independent of time-varying, which includes Linear Discriminant Analysis (LDA), K-Nearest Neighbors (KNN), Naive Bayes (NB), C4.5 algorithm (C4.5), Classification and Regression Trees (CART), Support Vector Machine (SVM), Random Forest (RF), Back-Propagation Neural Network (BPNN) and some Ensemble Algorithm such as Boosting, Bagging and Random Subspace. The other is dependent of time-varying. The classifiers for this type of data usually contain Hidden Markov Model (HMM) and Long Short-Term Memory (LSTM).
In combination with the features extracted from MSRAction3D dataset, we employ the classifiers without and with time-varying to deal with the first-level and second-level optimal classification unit respectively, where [OCU]1 and [OCU]2 as shown in Table
| Table 2 Classifiers in each level of OCU, where [OCU]1 and [OCU]2 represent the first-level and second-level optimal classification unit, respectively. . |
(iii) Algorithm Flow Chart
We give the flow chart of our simulation algorithm as shown in Fig.
 | Fig. 8 The two-level classification algorithm flow chart. |
4.3 Result
We perform ten times simulation tests and obtain the recognition rates, in which the maximum rate is 95.61%, the minimum is 92.87%, and the average is 94.19%. Obviously, our proposed algorithm has high potential for HAR. Furthermore, we give the confusion matrix corresponding to the best recognition result as shown in Table
| Table 3 The confusion matrix of best recognition result. . |
5 Discussion
5.1 Practicability
To evaluate the potential of our proposed method, we compare the recognition rates resulted from different approaches by using the MSRAction3D dataset as shown in Table
| Table 4 Methods comparison on MSRAction3D dataset, where Rmax represents the best recognition rate, Rmin represents the worst recognition rate, AVG represents the average recognition rate, and SD represents standard deviation of recognition rates(unit: %) . |
5.2 Robustness
Generally, some data are inevitably missing in the original dataset. For example, we find that there are 20 samples with missing data in the MSRAction3D dataset. Therefore, we design two sets of simulations with and without missing data, and the results are shown in Table
| Table 5 Results of control-experiments. . |
5.3 Extensibility
Our approach has an extensibility including horizontal expansion and vertical extension. Here, so-called horizontal expansion, we indicate that the number and types of classifiers in OCU can be increased or modified according to the different scenario. In this study, we adopt a two-level model of HAR, and select in each level of OCU different classifiers. Specifically, the employed classifiers are shown as given in Table
6 Conclusion
In conclusion, we have proposed a two-level hierarchical HAR model with self-selection classifiers, where the classifiers without and with time-varying are employed to deal with the first-level and the second-level optimal classification unit, respectively. Then, we have extracted the mean and variance of discrete time series to characterize the first-level coarse actions, and calculated the location and speed of the end-effector to distinguish the fine actions in the second level. We have applied the method to a public dataset, and achieved an average recognition rate 94.19% and the best rate 95.61%, which suggests that our proposed method is efficient in HAR, and hierarchical recognition strategy can better explain the internal mechanism of human action. However, how to recognize the human actions with large scale dataset and deal with the systems with a great number of missing data problems? This open question surely deserves further investigations and may be the content of a future presentation.
Reference
| [1] | |
| [2] | |
| [3] | |
| [4] | |
| [5] | |
| [6] | |
| [7] | |
| [8] | |
| [9] | |
| [10] | |
| [11] | |
| [12] | |
| [13] | |
| [14] | |
| [15] | |
| [16] | |
| [17] | |
| [18] | |
| [19] | |
| [20] | |
| [21] | |
| [22] | |
| [23] | |
| [24] | |
| [25] | |
| [26] | |
| [27] | |
| [28] | |
| [29] | |
| [30] | |
| [31] | |
| [32] | |
| [33] | |
| [34] | |
| [35] | |
| [36] | |
| [37] | |
| [38] | |
| [39] |