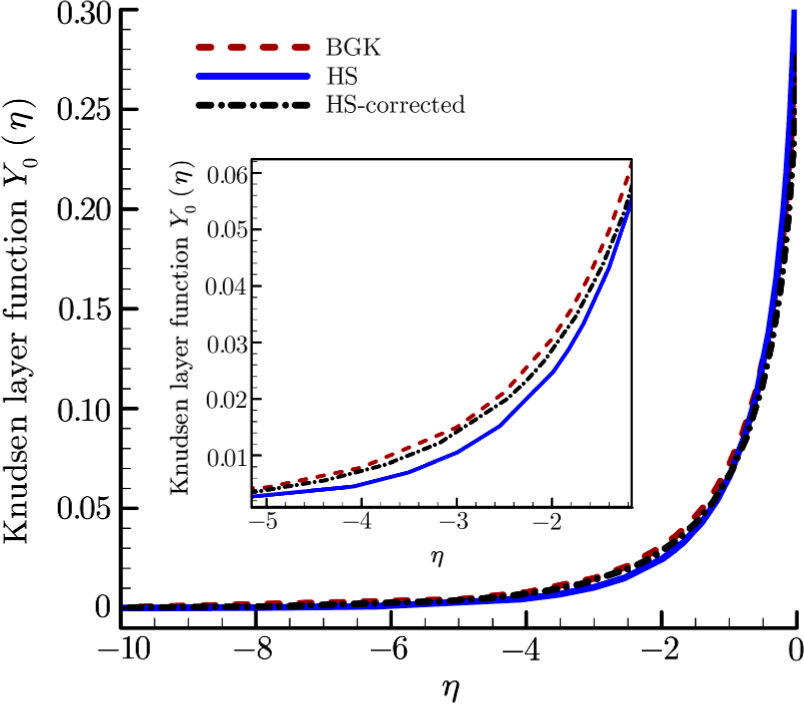
Profiles of the function Y0(η). A local enlargement of the curves is shown in the inset. The solid line is for the Hard Sphere (HS) model. The dashed line is for the BGK, and the dash-dotted line is for the Hard Sphere model with correction (HS-corrected).