


Molecular Dynamics Simulations of the Elastic Anisotropy of Pd at Extreme Conditions
Cite this Article
Zhang Xiu-Lu, Han Yun-Xia, Jia Hong, Qu Nuo, Liu Zhong-Li. Molecular Dynamics Simulations of the Elastic Anisotropy of Pd at Extreme Conditions. Communications in Theoretical Physics, 2018, 69(6): 735 
Permissions
Molecular Dynamics Simulations of the Elastic Anisotropy of Pd at Extreme Conditions
† Corresponding author. E-mail:
Supported by the National Natural Science Foundation of China (41574076), the Basic Research of Technology Program of China under Grant No. JSHS2014404B002, the Young Core Teacher Scheme of Henan Province under Grant No. 2014GGJS-108, and key project of science and technology research of Henan Provincial Education Department under Grant No. 18A140024
Abstract
Abstract
It is very interesting to discover the elastic properties of engineering material palladium, especially its elastic anisotropy along Hugoniot states. We here investigate the evolution of its high pressure and temperature (PT) elastic ansotropy along Hugoniot using molecular dynamics simulations based on accurate classical interatomic potential. In order to testify the validity of the interatomic potential of Pd in describing the high PT elastic properties, we calculate its isothermal and adiabatic elastic moduli using molecular dynamics method. The obtained data are in good agreement with experimental data. From the isothermal elastic constants, we deduce the Hugoniot acoustic velocities and find that the resulting data are in good agreement with experimental acoustic velocity data. Based on the reliable elastic constants, we further investigate the spacial elastic ansotropy along Hugoniot PT states. It is found that the spacial elastic anisotropy of Pd increases along Hugoniot states.
1 Introduction
Shock response characteristics of materials may reflect how they behave under dynamic load with increasing pressure and temperature simultaneously, specifically along a fixed shock orientation. Palladium plays an important role in variety of applications such as dentistry, jewelery, catalysis, metalizing ceramics, hydrogen storage, and so on.[1] In addition, bulk Pd is frequently used as a pressure calibrator in high-pressure experiments because of its stable face-centered-cubic (fcc) structure under high pressure. Theoretical studies of shock response of Pd is of vital importance for it as a pressure calibrator, especially in the regions where experiments cannot reach. The elastic properties of materials at high pressures are necessary for us to understand their underlying static and dynamic responses to pressure, mechanical strength, and the equation of states.
The elastic anisotropy can be conveniently achieved from elastic constants for all crystal systems. Ab initio calculations of elastic constants were often conducted at 0 K without any anharmonic effects, and the inclusion of temperature effects in ab initio elastic constants are always complex and computationally expensive. However, the elastic constants of a crystal decrease by over 20% with increasing temperature.[2–5] The temperature dependence of the elastic constants of a material is crucial for predicting and understanding the mechanical strength and even phase transitions of a crystal.[6] Furthermore, elastic anisotropy resulted from the elastic constants has also many other implications in dislocation dynamics and even geophysical significance of materials.[7] It has been demonstrated that the elastic anisotropy influences the nanoscale precursor textures in shape memory alloys and other materials.[8–9]
It is known that molecular dynamics (MD) simulations naturally includes high-temperature anharmonic effects to any order beyond Debye temperature.[10–11] And they especially apply to high-temperature free energy calculations[12] and thermal fluctuation average, for instance in the calculation of elastic constants. The combination of MD with accurate interatomic potential of crystal systems provides a valid way to yield reliable elastic constants under high PT.
The rest of the paper is organized as follows. In Sec.
2 Methodology
We calculate the high pressure and temperature (PT) elastic constants of Pd using classical MD simulations. In order to accurately describe the interatomic interactions of Pd atoms, we adopt the embedded-atom-method (EAM) potential.[13–14] Our previous study[1] verified the high quality of the EAM potential of Pd in describing the high PT properties. For a system with N atoms, the total potential energy Etot is the sum of the embedding energy F and a pair potential ϕ,
3 Results and Discussions
3.1 Isothermal Elastic Constants
The 300 K-isothermal elastic constants as a function of pressure are obtained and illustrated in Fig.

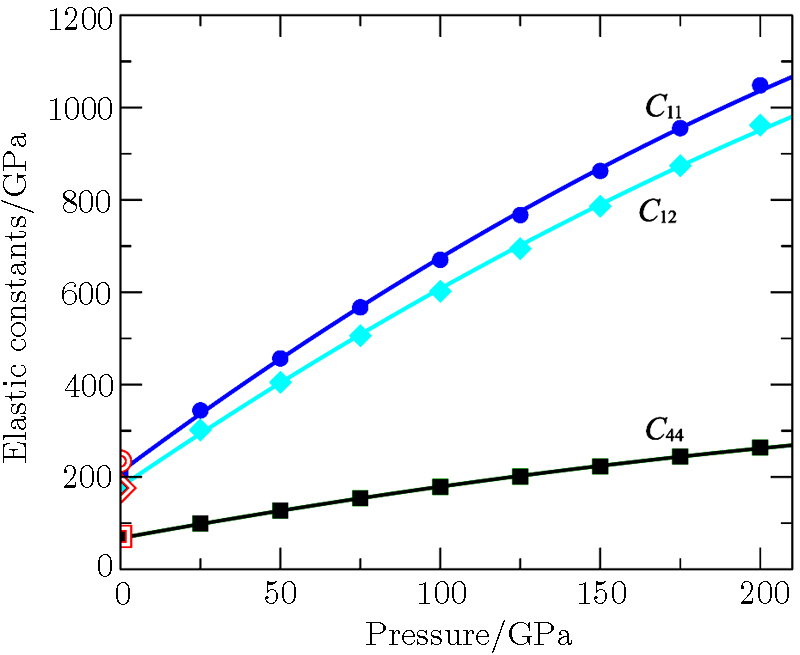 | Fig. 1 (Color online) The 300 K isothermal elastic constants of Pd as a function of pressure. The solid symbols are our calculated data. The lines are the second polynomial fit of the elastic constants. The red symbols are experimental values at 0 GPa.[17] |
After fitting the second order polynomial function to the three sets of elastic constants data respectively, we yield the function


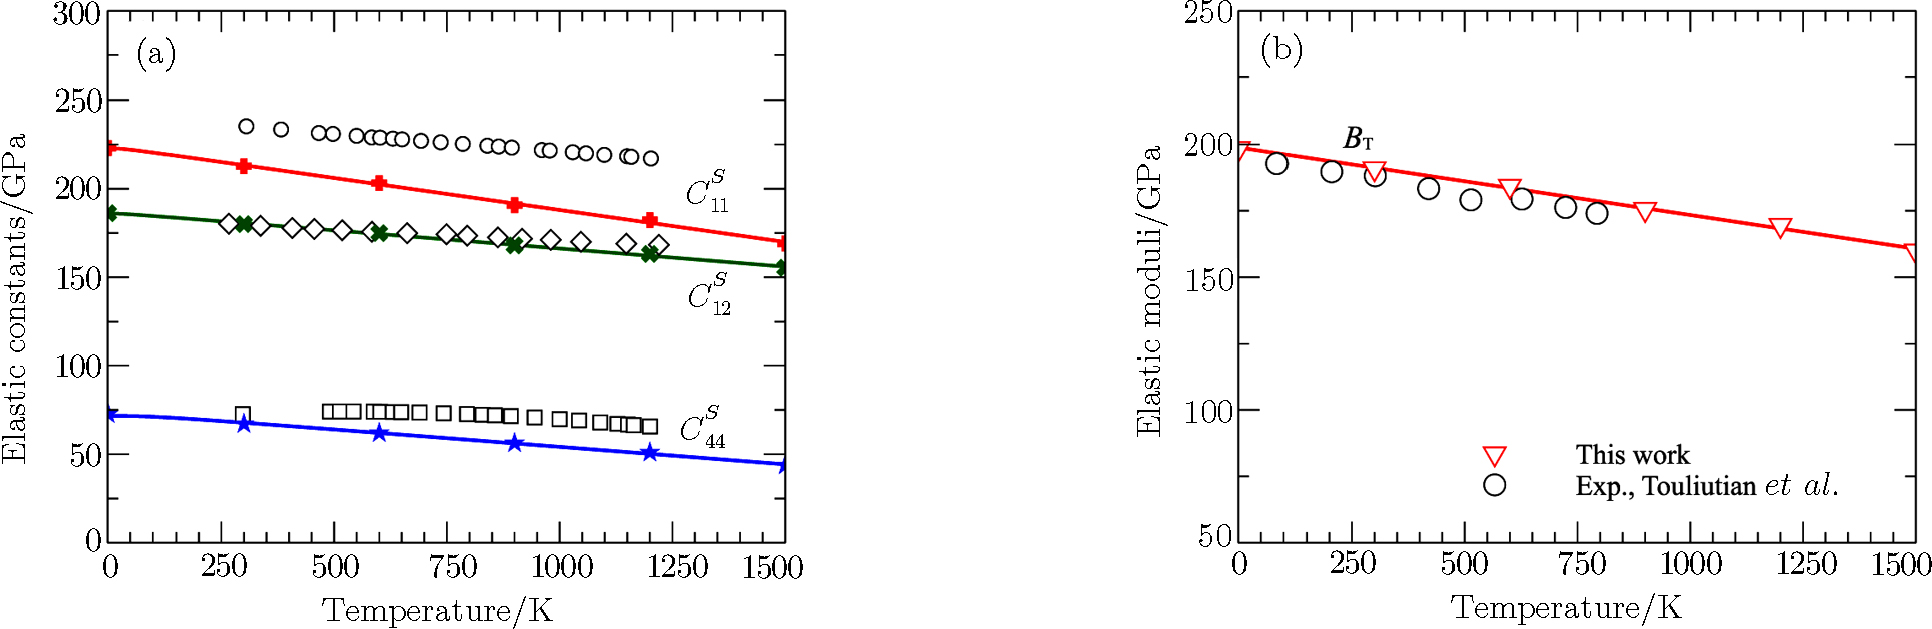
3.2 Isentropic Elastic Constants
The experimental elastic constants data[18–19] were isentropic data, therefore the calculated isothermal elastic constants should be converted in order to be compared with experiments.[5] For the cubic crystal, the conversion between isothermal and isentropic elastic constants are,[6]


The calculated temperature dependence of the isentropic elastic constants are shown in Fig. 


 | Fig. 2 (a) High-temperature isentropic elastic constants of Pd at 0 GPa, in comparison with experimental data. Open symbols are experimental data from Refs. [21], respectively. (b) The calculated isothermal bulk moduli of Pd compared with experiment.[22] All the calculated moduli were fitted to the Varshni equation.[20] |
3.3 Sound Velocity Along Hugoniot
13 ) and (15 ), the average isotropic shear modulus G of polycrystalline according to Voigt-Reuss-Hill approximations from single crystal elastic constants. The density ρ in Eqs. (13 ), (14 ), and (15 ) are derived by ρ = M/V, where M is the molecular mass and V is the corresponding unit cell volume at specific P and T, illustrated in the inset of Fig. 3(a) . The equilibrium volume V0 of Pd at 0 GPa and 300 K is 14.86 A3.
The obtained elastic constants and the corresponding Hugoniot PT points are listed in Table
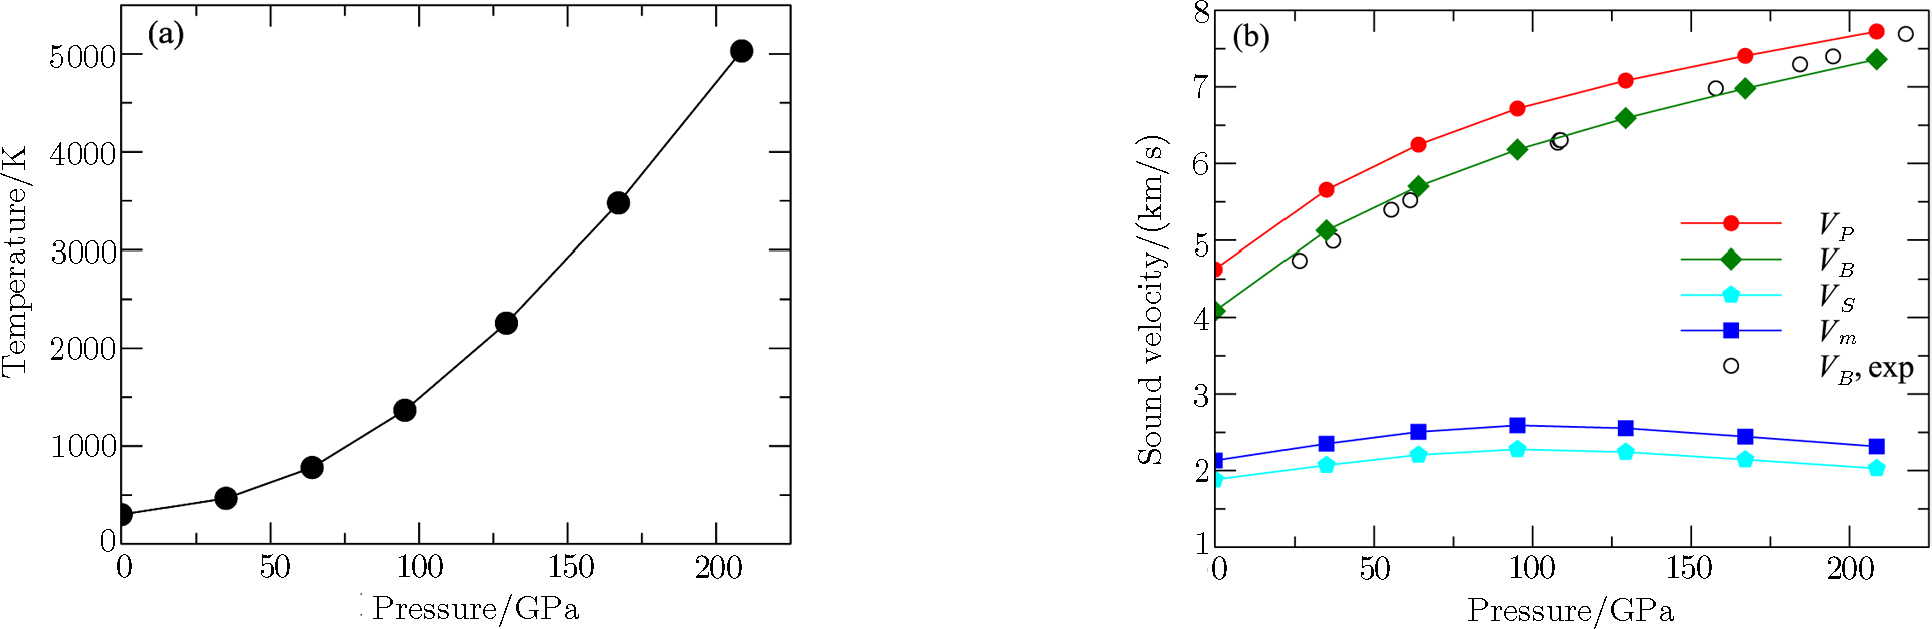 | Fig. 3 (a) The Hugoniot pressure-temperature relations. (b) The Hugoniot acoustic velocities of Pd compared with the experimental data.[23] |
| Table 1 The elastic constants along Hugoniot PT states. . |
The phase velocity v and polarization of the three waves along a fixed propagation direction defined by the unit vector ni are given by Cristoffel equation,


The average wave velocity vm is calculated from,
The acoustic velocities of Pd as a function of pressure along Hugoniot states are illustrated in Fig.
As shown in Fig.
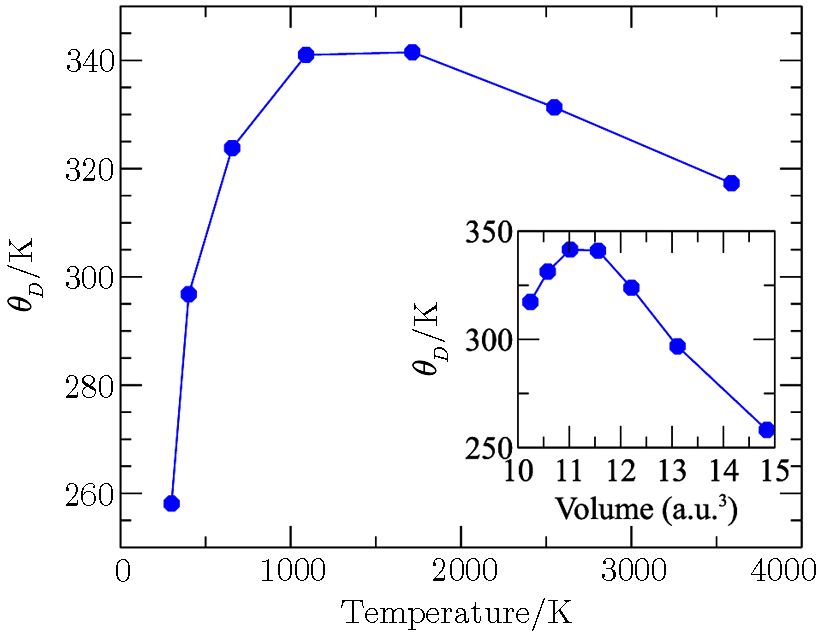 | Fig. 4 Debye temperature of Pd at 0 GPa. |
3.4 Elastic Anisotropy Along Hugoniot
From Subsecs.
The Young’s modulus, shear modulus, and Poisson’s ratio are all dependent on orientation.[24–25] It is specially interesting to uncover the evolution process of these elastic properties along the Hugoniot states. From the elastic constants, we calculate their orientation dependence for Pd along the Hugoniot states. Detailed method can be found in Ref. [25]. In Fig.
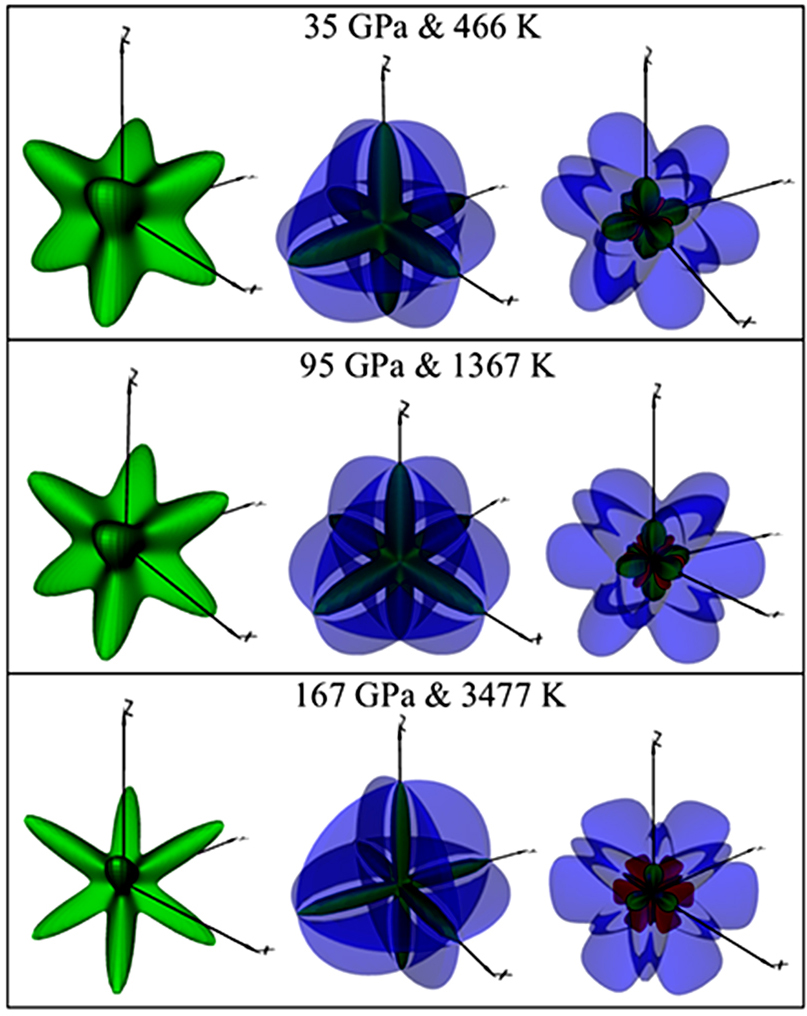 | Fig. 5 (Color online) The spacial orientation variation of the Young’s modulus, shear modulus, and poisson ratio of Pd along the principle Hugoniot. In the multi-colored figures, blue color accounts for maximum, green for minimum positive, red for negative. |
In order to understand the variation of elastic anisotropy of Pd along specific directions, the 2D Poisson’s ratio in the (110) plane is calculated and plotted in Fig.
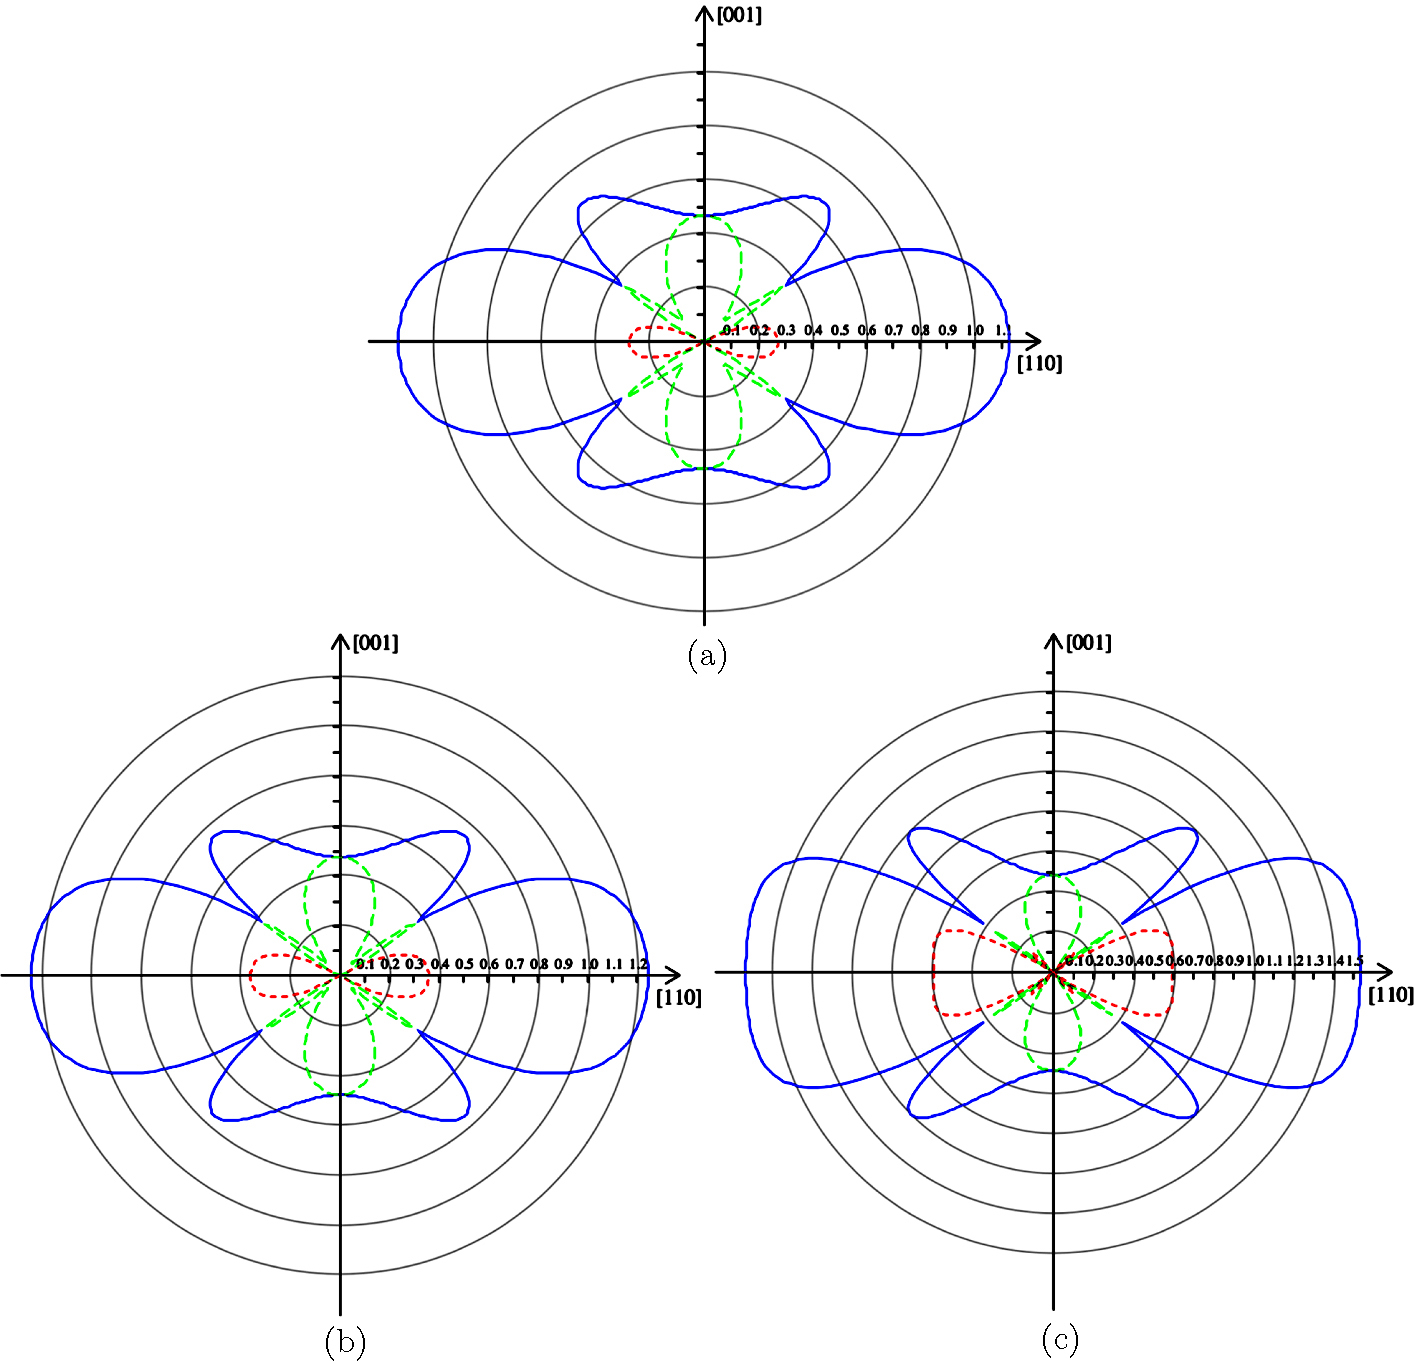 | Fig. 6 (Color online) 2D representation of Poissons ratio in the (110) plane for Pd at (a) 35 GPa and 466 K, (b) 95 GPa and 1367 K and (c) 167 GPa and 3477 K; maximum (blue), minimum positive (green) and minimum negative (red). |
4 Conclusion
In conclusion, we have investigated the elastic properties of Pd under high PT systematically. Firstly, we calculate the isothermal elastic constants of Pd from molecular dyanmics simulations based on accurate interatomic potential. From the isothermal elastic constants, we deduce the high temperature isentropic elastic moduli of Pd and find they are in good agreement with experimental data at 0 GPa. Secondly, we achieve the acoustic velocities of Pd at high PT along Hugoniot states. The derived compressional wave velocity is also in good agreement with shock wave experiment. Finally, we investigate the elastic anisotropy of Pd along Hugoniot states. It is found that the spacial elastic anisotropy of Pd, reflected by the Young’s modulus, the shear modulus, the acoustic velocity and Poisson ratio, increases with increasing PT along Hugoniot states.
Reference
| [1] | |
| [2] | |
| [3] | |
| [4] | |
| [5] | |
| [6] | |
| [7] | |
| [8] | |
| [9] | |
| [10] | |
| [11] | |
| [12] | |
| [13] | |
| [14] | |
| [15] | |
| [16] | |
| [17] | |
| [18] | |
| [19] | |
| [20] | |
| [21] | |
| [22] | |
| [23] | |
| [24] | |
| [25] |