2. 河南省农业科学院植物营养与资源环境研究所,河南郑州 450002;
3. 河北农业大学资源与环境科学学院,河北保定 071001
2. Institute of Plant Nutrient and Environment Resources, Henan Academy of Agricultural Sciences, Zhengzhou, Henan 450002, China;
3. College of Resources and Environment Science, Hebei Agricultural University, Baoding, Hebei 071001, China
磷是作物生长发育不可缺少的大量营养元素之一,作物吸收的磷素主要来源于土壤,土壤缺磷不仅影响作物的营养生长,而且影响作物的生殖生长,最终影响作物的产量和品质[1]。磷肥施用可在很大程度上增加土壤有效磷 (Olsen-P) 含量[2],进而提高作物产量[3–5]。近年来,我国大部分地区土壤Olsen-P水平从20世纪80年代的10 mg/kg提高到了现在的20 mg/kg以上[6],有的甚至超过100 mg/kg[7]。但是,土壤磷水平的提高也将导致土壤磷素的淋失风险增加[8–10]。
溶解性磷是土壤在蒸馏水或稀的电解质溶液作用下,从土壤固相进入液相的磷。由于使用蒸馏水提取往往得不到清澈的提取液,在研究过程中常以0.01 mol/L CaCl2溶液代替蒸馏水进行提取 (CaCl2-P)[11]。土壤溶液中的磷是最有效的,可供作物直接吸收利用,因此,CaCl2-P的大小可以直接反映土壤磷素的肥力水平。同时,CaCl2-P也是表征土壤磷素淋失风险的一个重要指标[12]。研究发现土壤溶解性磷与径流中的磷含量相关性最好,被用于表征可被藻类生长直接吸收利用的磷[13–14]。
土壤Olsen-P的快速准确测定使得人们可以根据土壤磷素状况进行合理施肥,为保持和提高土壤生产力作出了重要贡献,因此得到了广泛应用[3],而可供利用和参考的CaCl2-P资料则较少,因此研究土壤Olsen-P与CaCl2-P 的关系,用土壤Olsen-P含量评估土壤磷淋失风险成为热点[15]。CaCl2-P含量随着土壤Olsen-P的增加,通常会出现“突变点” (change-point)[12],即分别用土壤Olsen-P与CaCl2-P含量为x轴和y轴作相关曲线,曲线上的转折点对应的Olsen-P含量即为该土壤的磷素淋失临界值。当土壤Olsen-P含量小于“突变点”时,不会发生磷素淋失,反之就会发生磷素淋失。国内利用CaCl2-P和Olsen-P间的关系来评价土壤磷素淋失风险已有少量的文献报道[16–17]。Bai等[16]利用此方法发现杨凌鴥土、哈尔滨黑土、重庆紫色土以及祁阳红壤“突变点”时的Olsen-P含量分别为39.9、51.6、40.2和90.2 mg/kg;钟晓英等[17]研究显示我国10种土壤类型23个土壤“突变点”时的Olsen-P含量在29.96~156.78 mg/kg之间。他们的研究结果表明不同土壤类型“突变点”对应的Olsen-P含量差异很大,而且多通过向土壤中添加KH2PO4溶液进行室内培养的方法形成土壤Olsen-P梯度,利用田间条件下形成的Olsen-P梯度土壤进行测定的结果还不多见。
潮土区是我国重要的小麦、玉米主产区,分布在黄河、淮河、海河流域,这几个水系是黄淮海地区主要的饮用水和灌溉水来源。约75%的潮土质地较轻且分布区域每年7—9月雨季集中,因此潮土磷肥安全施用问题不容忽视[18]。2015年2月,农业部印发了《到2020年化肥使用量零增长行动方案》[19]。要实现这个目标,在不同Olsen-P含量土壤上实行不同的磷肥施用策略是个行之有效的方法,既可保证高产高效,又可避免土壤磷潜在淋失风险。目前,不同Olsen-P含量潮土上磷肥施用对土壤CaCl2-P的影响以及土壤磷的潜在淋失风险研究还较少。因此,本试验依托持续26年长期定位试验形成的不同Olsen-P含量的土壤,结合田间微区试验,设置不同的磷肥施入量,分析磷肥施用对不同Olsen-P含量潮土CaCl2-P含量的影响,评价土壤磷素的淋失风险,可为该地区磷肥投入和土壤磷素的科学管理提供理论依据,对降低农田磷素的环境风险和保障生态环境安全具有重要的指导意义。
1 材料与方法 1.1 试验地点试验在“国家潮土土壤肥力和肥料效益长期监测基地” (113°41.5′25.5″E、35°00′31.9″N) 进行。该基地位于河南省郑州市,海拔59.0 m,属于温带湿润−半湿润季风气候,年平均气温14.4℃,年降水量700 mm,年蒸发量2300 mm,年日照时数2324.5 h。土壤母质为黄土性沉积物,土壤质地为轻壤,大于0.01 mm的物理性砂粒含量为74%。该基地建于1990年,当年土壤 (0—20 cm) 有机质含量10.1 g/kg、全氮0.65 g/kg、全磷0.64 g/kg、全钾16.9 g/kg、碱解氮76.6 mg/kg、有效磷6.5 mg/kg、速效钾74 mg/kg、pH 8.3[20]。
1.2 试验设计试验区种植作物为夏玉米–冬小麦双季轮作,夏玉米为6月上旬播种,9月中旬收获,冬小麦为10月上旬播种,次年6月上旬收获。生长季期间,人工除草。本研究主要选择5个施肥处理:1) 对照 (不施肥);2) NPK (施氮磷钾肥);3) 预备处理 (化肥处理,每年根据需要施用氮磷或磷钾肥);4) NPKM (化肥 + 有机肥处理);5) 1.5NPKM (1.5倍化肥 + 1.5倍有机肥)。NPK和NPKM为等氮处理,无机氮与有机氮之比为7∶3,N∶P2O5∶K2O = 1∶0.5∶0.5。小麦每季施N 165.0 kg/hm2、P2O5 82.5 kg/hm2、K2O 82.5 kg/hm2;玉米每季施N 187.5 kg/hm2、P2O5 93.8 kg/hm2、K2O 93.8 kg/hm2。
经过长达26年的不同施肥措施,对照、NPK、预备处理、NPKM和1.5NPKM处理 (以下简称OP1、OP2、OP3、OP4、OP5) 的土壤Olsen-P含量产生了巨大差异 (表1)。2016年5月小麦收获后,在5个处理上分别设置了5个施磷量梯度 (F0、F1、F2、F3、F4),每个梯度3次重复,采取微区形式,随机区组设计,每个微区面积为0.72 m2 (1.2 m × 0.6 m),微区之间用石板隔开,石板深度为60 cm。种植作物与长期定位试验一致,氮、磷、钾肥均是在播种前作底肥一次性施入,人工撒施,然后利用铁锹均匀翻入0—20 cm深度土壤。在2016年5月小麦收获后微区试验开始前,每个处理用土钻进行多点采样并混合成一个土样作为微区试验的初始土样,采样深度0—20 cm。5个Olsen-P含量土壤初始土样的化学性质及各处理氮、磷、钾投入量分别见表1和表2。
| 表1 微区试验前5个处理土壤基本化学性质 (0—20 cm) Table 1 Basic soil chemical properties of five treatments before implementing micro-plots experiments |
 |
| 表2 微区试验玉米、小麦施磷量 (P2O5 kg/hm2) Table 2 P application rates for maize and wheat in the micro-plot experiment |
 |
于2017年10月采集土壤样品,即微区试验第3季作物玉米收获后,利用取土钻在每个小区内随机选取3点进行取土,采样深度为0—20 cm,然后混合成1个土壤样品。土壤样品风干后,去除肉眼可见的有机残体,过2 mm筛备用。
土样测定参照土壤农化常规分析方法[21],土壤Olsen-P采用NaHCO3提取 (pH 8.5,液土比20∶1),CaCl2-P 用0.01 mol/L CaCl2溶液提取 (液土比 5∶1),25℃恒温震荡30 min,用钼锑抗比色法测定。
1.4 数据处理采用SPSS 10.0进行方差分析,多重比较采用Duncan法。采用Origin 8.0作图,图中数据为平均值 ± 标准误。土壤Olsen-P与CaCl2-P的定量关系利用Sigmaplot 10.0的双直线模型进行拟合,拟合方程如下:
y = a1 + b1 x x < T
y = a2 + b2 x x ≥ T
式中:y是土壤CaCl2-P含量 (mg/kg);x是土壤Olsen-P含量 (mg/kg);a1和a2是拟合直线的截距;b1和b2是斜率;T是突变点的Olsen-P含量 (mg/kg)[15]。
2 结果与分析 2.1 土壤Olsen-P含量的变化经过3季不同施肥措施后,在OP1~OP5 五个处理土壤Olsen-P含量分别为2.3~5.7、7.5~18.2、7.6~26.3、29.1~50.9和34.1~59.7 mg/kg (表3),与初始Olsen-P含量规律基本一致,但OP1和OP2、OP2和OP3之间差异不显著。相对不施磷处理,施磷处理下土壤Olsen-P有不同程度的提高,F1、F2、F3、F4处理下土壤Olsen-P含量相比F0分别提高了33.3%、51.5%、67.0%和96.3% (OP1~OP5的平均值)。施磷量越高,土壤Olsen-P增长幅度越大,其中F4处理土壤Olsen-P显著大于F0 (表3)。不同处理土壤Olsen-P的提升幅度也不一样,OP1至OP5土壤上,施磷导致的土壤Olsen-P含量分别提高了65.0%、57.3%、115.0%、36.2% 和36.5% (F1~F4的平均值),初始Olsen-P含量越高,提升幅度越低 (OP3除外)。
| 表3 不同处理磷肥施用引起的土壤Olsen-P含量差异 (mg/kg) Table 3 Difference in soil Olsen-P caused by P fertilization in different treatments |
 |
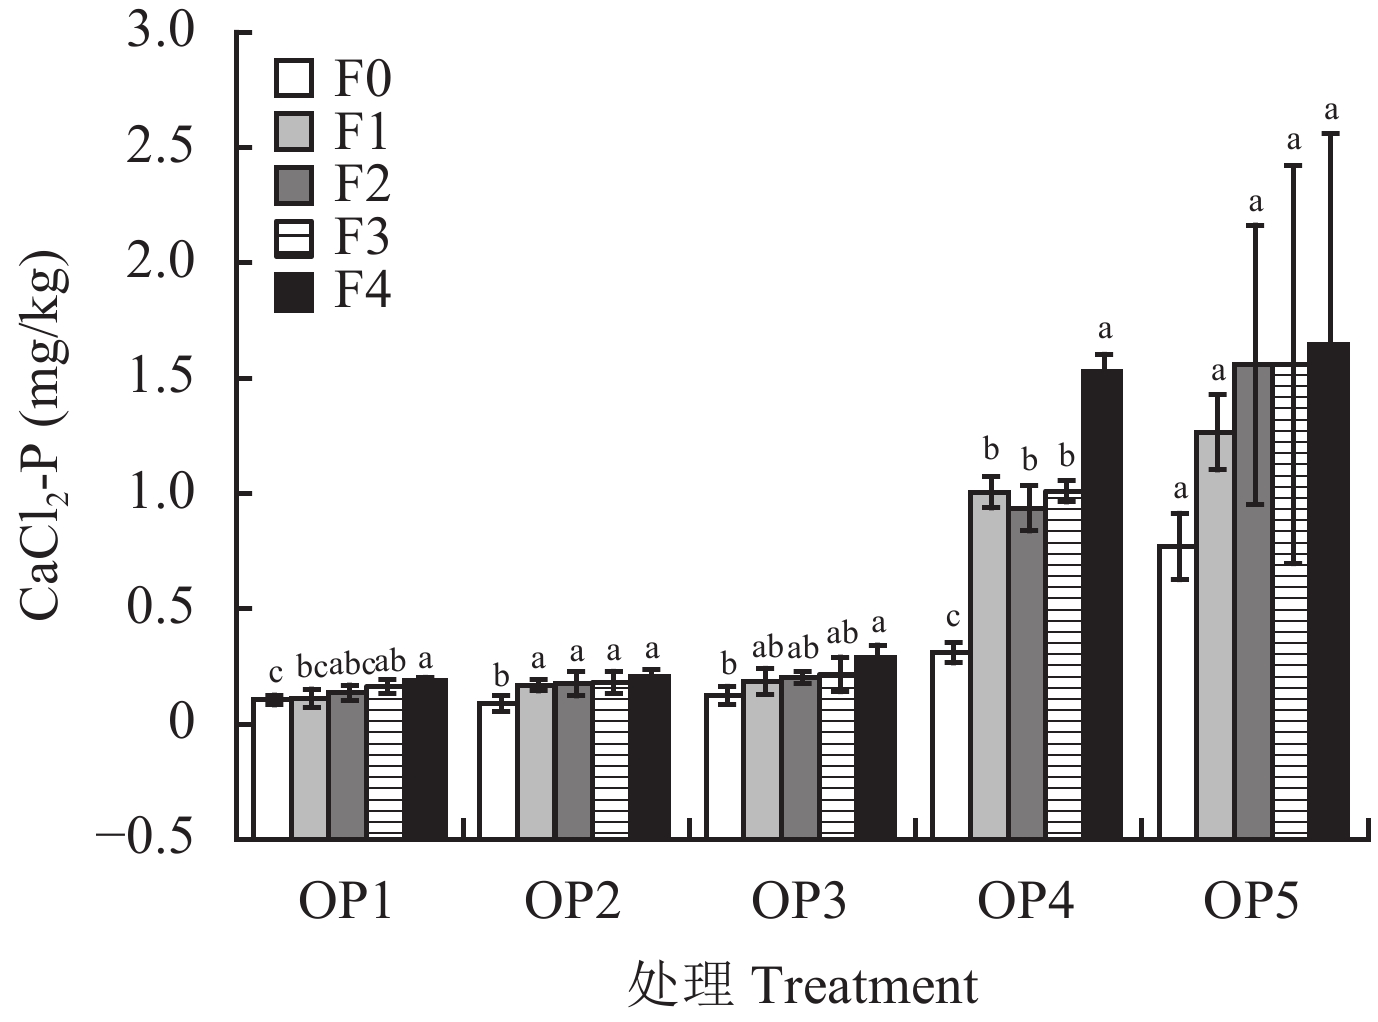
土壤CaCl2-P含量在0.07~2.68 mg/kg之间 (图1)。同土壤Olsen-P变化规律一致,CaCl2-P在OP1、OP2和OP3之间没有显著差异,且含量均很低,小于0.34 mg/kg。OP4和OP5两个处理土壤CaCl2-P含量显著提高 (0.32~1.68 mg/kg),但是除F0和F2两个施磷量水平外,OP4和OP5之间CaCl2-P含量没有显著差异。在同一Olsen-P含量的土壤中,相对不施磷处理,施磷处理下土壤CaCl2-P有不同程度的提高,随着施磷量的增加,CaCl2-P有增加的趋势,施磷量越高,土壤CaCl2-P增长幅度越大,其中F4处理土壤CaCl2-P显著大于F0 (OP5除外,图1)。
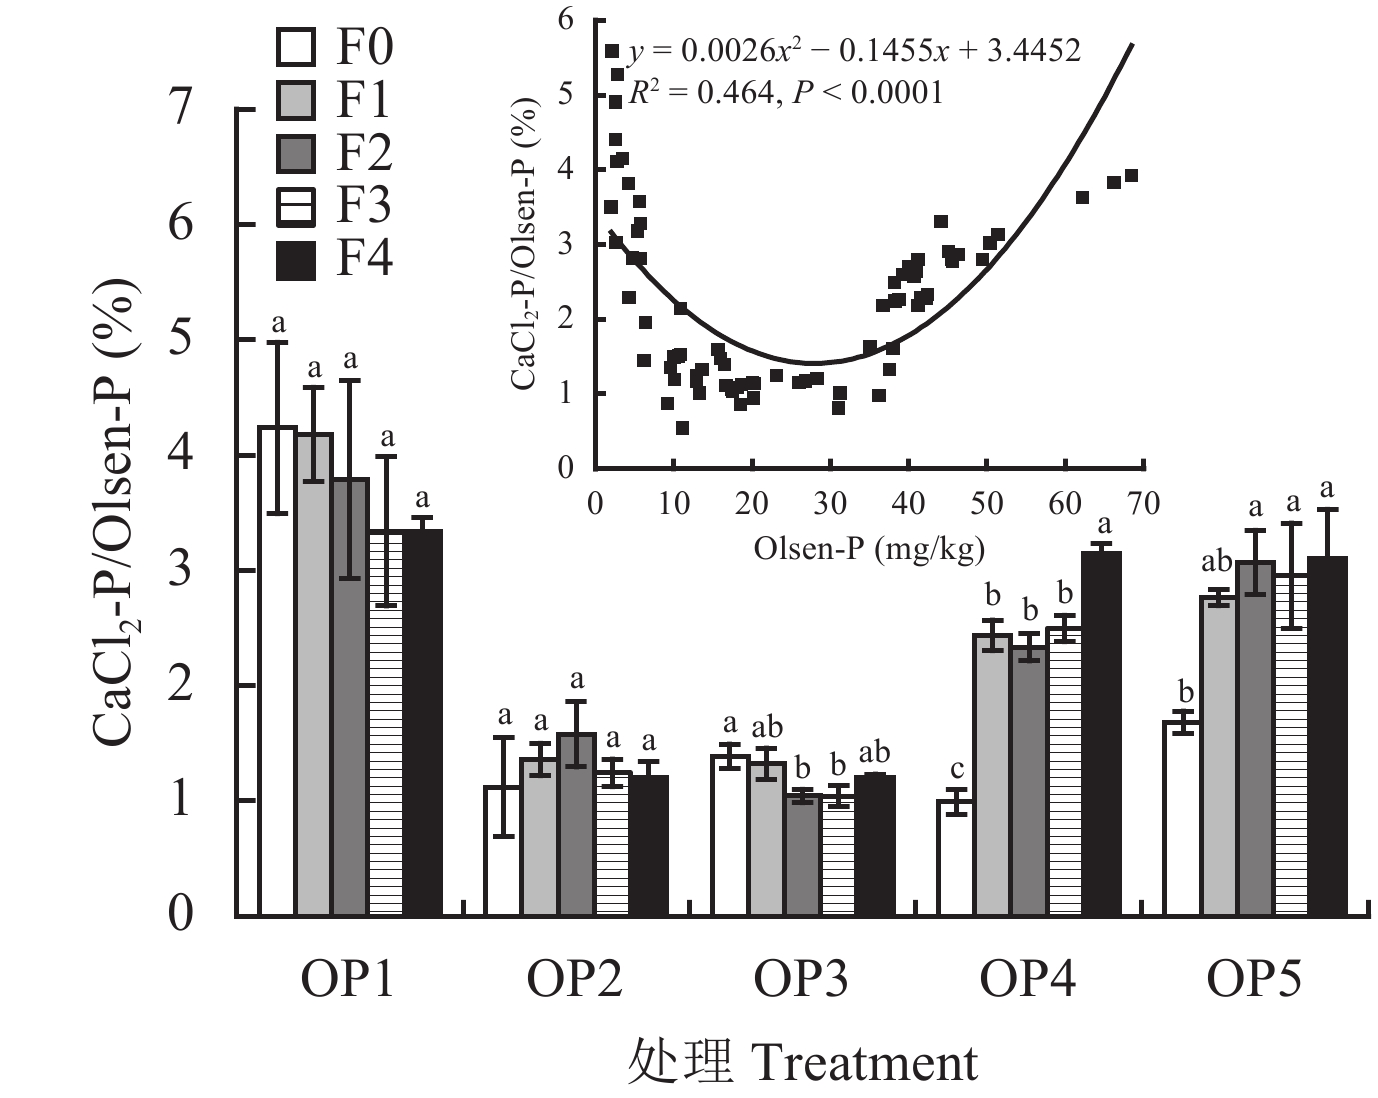
CaCl2-P/Olsen-P比值在0.5%~5.6%之间,与土壤CaCl2-P表现规律不同,CaCl2-P/Olsen-P比值在5个处理中呈现先减小后增大的趋势 (图2)。在OP1、OP2、OP3三个低Olsen-P含量土壤上,施磷对CaCl2-P/Olsen-P比值的影响不显著,在OP4和OP5两个高Olsen-P含量土壤上,施磷明显提高了CaCl2-P/Olsen-P比值 (图2)。CaCl2-P/Olsen-P比值与Olsen-P的关系符合一元二次方程 (R2 = 0.464,P < 0.0001),在Olsen-P含量为28.0 mg/kg时CaCl 2-P/Olsen-P比值最小,最小值为1.4%。
 |
| 图2 土壤CaCl2-P/Olsen-P比值的变化及其与Olsen-P 的关系 Fig. 2 Variance in the ratio of CaCl2-P/Olsen-P and its relation with Olsen-P [注(Note):柱上不同字母表示不同处理间差异达 5% 显著水平Different letters above the bars represent significant difference at the 5% level among treatments.] |
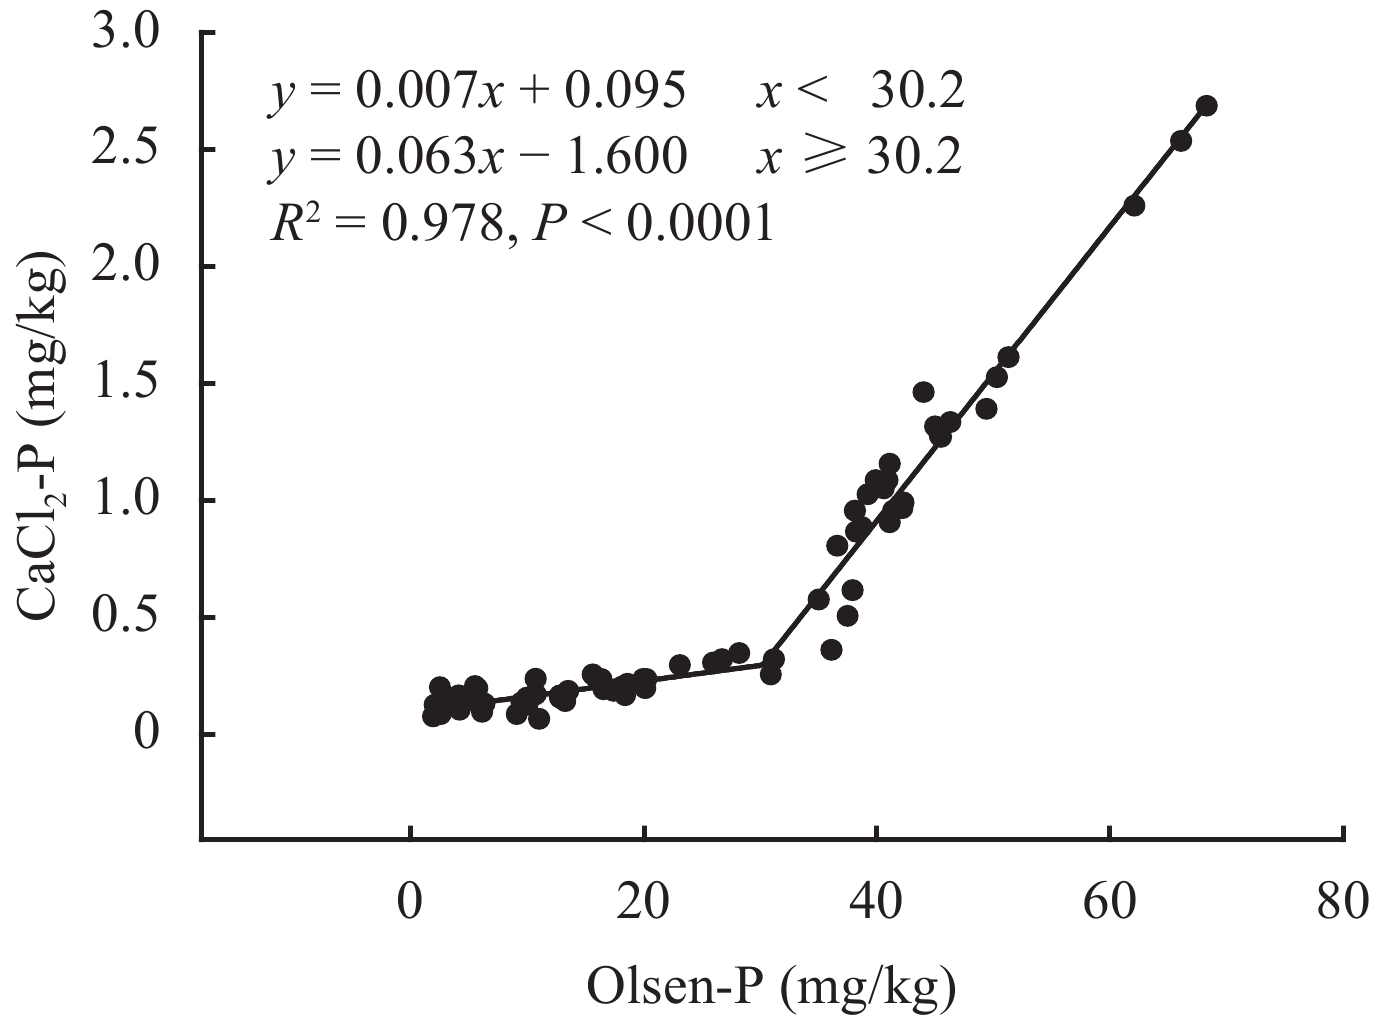
土壤CaCl2-P和Olsen-P的关系符合双直线模型 (图3),两条直线之间有一个明显的突变点,即土壤磷素淋失临界值。本研究中土壤磷素淋失临界值为30.2 mg/kg,对应的CaCl2-P浓度为0.3 mg/kg。当土壤Olsen-P含量小于30.2 mg/kg时,CaCl2-P随Olsen-P增加而增加的幅度较小,Olsen-P每增加1 mg/kg,CaCl2-P仅增加0.007 mg/kg。当土壤Olsen-P含量大于30.2 mg/kg时,CaCl2-P随Olsen-P增加而增加的幅度提高9倍,即Olsen-P每增加1 mg/kg,CaCl2-P增加0.063 mg/kg。
 |
| 图3 土壤CaCl2-P与Olsen-P含量的定量关系 Fig. 3 Quantitative relationship between CaCl2-P and Olsen-P contents |
本研究中,土壤CaCl2-P含量为0.07~2.68 mg/kg,约为Olsen-P含量的0.5%~5.6%。土壤Olsen-P和CaCl2-P的大小在某种程度上可以反映土壤向作物提供磷素的数量和强度。经过26年长期不同施肥措施,土壤Olsen-P含量发生了很大变化,这为本研究提供了良好的研究平台。从短期来看,经过3季施肥处理,相对不施磷处理,磷肥施用在不同初始Olsen-P含量土壤上使Olsen-P和CaCl2-P均有不同程度的提高,但只有P2O5 120 kg/hm2的高量磷肥达到了显著水平 (OP5除外,表3和图1)。
 |
| 图1 不同处理下磷肥施用引起的土壤CaCl2-P的差异 Fig. 1 Difference in soil CaCl2-P caused by phosphorus fertilization in different treatments [注(Note):柱上不同字母表示不同处理间差异达 5% 显著水平Different letters above the bars represent significant difference at the 5% level among treatments.] |
磷肥施用对Olsen-P和CaCl2-P的提高作用并不同步。在土壤Olsen-P较低时,施入的磷肥以提高土壤Olsen-P为主,CaCl2-P变化不大,导致CaCl2-P/Olsen-P比值逐渐降低 (图2)。当土壤Olsen-P增加到一定程度后,CaCl2-P迅速增加,其增长速度超过了Olsen-P的增长速度,CaCl2-P/Olsen-P比值随着Olsen-P的增加而增加。土壤粘粒和其他组分如CaCO3 (石灰性土壤) 通过吸附或化学沉淀等过程对外源磷有强烈的固定,施入土壤中的水溶性磷很快向其他形态转化。当土壤溶液中磷酸盐浓度降低时,被吸附固定的磷在形态转化以及溶解、扩散等过程的驱动下亦可被释放进入土壤溶液中进而被植物吸收。因此,土壤固-液相间的磷处在一种动态平衡中[22]。当Olsen-P处于初始积累阶段时,随着磷肥的施入,Olsen-P增加,但是Olsen-P与CaCl2-P之间的转化相对稳定;当Olsen-P积累到一定程度,土壤对外源磷的吸附强度减弱,土壤新吸附的磷更容易解吸[23],随着磷肥的施入,CaCl2-P增加的速度更快,Olsen-P与CaCl2-P之间达到一种新的平衡。一元二次方程结果显示出现转折点时土壤Olsen-P含量为28.0 mg/kg,这与土壤磷素淋失临界值很接近,说明CaCl2-P增加虽然有利于作物对磷的吸收,但是极大地增加了土壤磷素淋失的风险[24–25]。
3.2 土壤磷素淋失临界值土壤CaCl2-P和Olsen-P的关系符合双直线模型 (图3),突变点时土壤Olsen-P含量为30.2 mg/kg,对应的CaCl2-P含量为0.3 mg/kg。钟晓英等[17]通过室内培养的方法对我国10种土壤类型23个土壤进行了研究,发现突变点时的Olsen-P含量在29.96~156.78 mg/kg之间,CaCl2-P含量为0.14~3.87 mg/kg。Hesketh等[12]对英国不同地区8个性质差异较大的土壤研究发现土壤磷素淋溶的Olsen-P临界值为13~119 mg/kg,不同土壤之间相去甚远,很难用来判断一个具体土壤的磷淋失风险。黄绍敏等[18]研究了本研究区土壤Olsen-P在土壤剖面的垂直移动,发现当耕层土壤Olsen-P 小于20 mg/kg时,40—60 cm土层Olsen-P 含量15年基本维持在5 mg/kg,向下迁移趋势不明显;而当耕层土壤Olsen-P含量高于40 mg/kg,同期40—60 cm土层Olsen-P含量接近10 mg/kg,表明Olsen-P已经向下迁移。有研究表明,土壤磷素淋失临界值大约是磷农学临界值的2~10倍[26]。在本研究区,小麦和玉米的Olsen-P农学临界值分别为13.1和7.5 mg/kg[27],本研究得出的磷素淋失临界值分别为其的2.3倍和4倍,也说明本研究得出的磷素淋失临界值是合理的。
CaCl2-P含量主要表征土壤溶液中磷含量的大小,其为土壤磷酸盐沉淀与溶解、吸附与解吸反应平衡的结果[22]。当土壤Olsen-P含量超过磷素淋失临界值时,土壤固相上的磷更容易进入液相。不同类型土壤的磷酸盐数量、种类及形态存在很大差异,磷素吸附−解吸的机制可能也不同[27–28]。因此,土壤固相上的磷进入液相的数量存在差异,并反映在Olsen-P与CaCl2-P之间的关系及临界值上,使得不同土壤的磷素淋失临界值不同[17]。研究表明,土壤磷素临界值与pH呈抛物线关系,在土壤pH 6左右时磷素淋失临界值最高,当土壤pH > 6.0时,随土壤pH提高临界值减小 [29]。本研究土壤为石灰性土壤,pH 8.3,所以土壤磷素淋失临界值偏小,位于其范围值的低值端。Fortune等[30]发现土壤磷素淋失临界值与土壤有机质和活性铝的含量有显著的正相关。但是,有机质对土壤吸附磷的影响具有双重性。一方面,有机质本身具有吸附磷酸盐的能力,同时有机质螯合铁铝,提高其活性,也能增强土壤对磷的吸附固定[31];另一方面,有机阴离子与磷酸根竞争固相专性吸附点位,有机质中的有机酸还能够与颗粒表面的磷酸根离子发生置换反应,从而减少土壤对磷的吸附[32]。土壤粘粒含量可以促进土壤对磷的吸附[33],但是,土壤磷素淋失临界值与土壤粘粒 (< 0.002 mm) 含量之间并没有显著的相关性[29]。因此,不同土壤之间磷素淋失临界值的差异机制还有待进一步深入研究。
一般认为如果水体含磷量超过P 0.02~0.035 mg/L就极有可能导致藻类大量繁殖[34]。假定CaCl2-P为土壤溶液中的磷,土壤含水量为10%,Olsen-P为30.2 mg/kg时,土壤溶液磷的浓度为0.03 mg/L。因此在研究区,如果土壤Olsen-P超过临界值30.2 mg/kg,从土体排出的水进入河流或湖泊,极有可能导致水体富营养化。Sims等[35]也发现当土壤Olsen-P含量达到25 mg/kg时,就水质保护来说已处于过高水平。微区试验超过50%的小区土壤Olsen-P含量已经超过磷素淋失临界值,存在磷素淋失风险,应加强农田磷肥的科学施用和管理。但需要指出的是,从土体排出水中磷的组成和形态与CaCl2溶液所浸提出来的磷可能不同,只有溶解态磷才能被水体生物吸收利用,而颗粒状磷对藻类的有效性只有30%左右[36]。因此,下一步的研究应建立土体排出水总磷含量与CaCl2-P之间的关系,通过测定CaCl2-P来预测从土体排出水的磷浓度,从而评估土壤磷素淋失对水体的污染。
4 结论1) 土壤CaCl2-P含量为0.07~2.68 mg/kg,约为Olsen-P含量的0.5%~5.6%。短期施高量磷肥可以显著提高土壤Olsen-P和CaCl2-P含量,但土壤Olsen-P和CaCl2-P的增加不同步。当土壤Olsen-P低于28.0 mg/kg时,CaCl2-P变化不大,当Olsen-P增加至28.0 mg/kg后,CaCl2-P迅速增加,这一方面有利于作物对磷的吸收,另一方面也极大地增加了土壤磷素淋失的风险。
2) 土壤CaCl2-P和Olsen-P的关系符合双直线模型,突变点时土壤Olsen-P含量为30.2 mg/kg,对应的CaCl2-P含量为0.3 mg/kg。微区试验中超过50%的小区土壤Olsen-P含量已经超过磷素淋失临界值,存在磷素淋失风险,应加强农田磷肥的科学施用和管理。
| [1] | Solomon R I, Saddiq A M, Usman B H. Effects of organic materials on phosphorus forms under submerged condition in the soils of Lake Geriyo irrigation project, Adamawa State, Nigeria[J]. IOSR Journal of Agriculture and Veterinary Science, 2014, 7: 11–18. |
| [2] | Olsen S R, Cole C V, Watanabe F S, et al. Estimation of available phosphorus in soils by extraction with sodium bicarbonate [M]. Washington, DC, USA: USDA Circ. 939. U.S. Gov. Print Office, 1954. |
| [3] | Wang Y L, Gao Z Q, Wang Y, et al. Phosphorus availability and transformation as affected by repeated phosphorus additions in an Ultisol[J]. Communications in Soil Science and Plant Analysis, 2015, 46: 1922–1933. DOI:10.1080/00103624.2015.1069305 |
| [4] | Shen P, Xu M G, Zhang H M, et al. Long-term response of soil Olsen P and organic C to the depletion or addition of chemical and organic fertilizers[J]. Catena, 2014, 118: 20–27. DOI:10.1016/j.catena.2014.01.020 |
| [5] | Xi B, Zhai L M, Liu J, et al. Long-term phosphorus accumulation and agronomic and environmental critical phosphorus levels in Haplic Luvisol soil, northern China[J]. Journal of Integrative Agriculture, 2016, 15: 200–208. DOI:10.1016/S2095-3119(14)60947-3 |
| [6] | Li H, Huang G, Meng Q, et al. Integrated soil and plant phosphorus management for crop and environment in China. A review[J]. Plant and Soil, 2011, 349(1-2): 157–167. DOI:10.1007/s11104-011-0909-5 |
| [7] |
徐明岗, 张文菊, 黄绍敏, 等. 中国土壤肥力演变(第二版)[M]. 北京: 中国农业科学技术出版社, 2015.
Xu M G, Zhang W J, Huang S M, et al. Soil fertility evolution in China (2nd edition) [M]. Beijing: China Agricultural Science and Technology Press, 2015. |
| [8] | Mihailescu E, Murphy P N C, Ryan W, et al. Phosphorus balance and use efficiency on 21 intensive grass-based dairy farms in the South of Ireland[J]. Journal of Agriculture Science, 2015, 153: 520–537. DOI:10.1017/S0021859614000641 |
| [9] | Zafar M, Tiecher T, de Castro Lima J A M, et al. Phosphorus seasonal sorption-desorption kinetics in suspended sediment in response to land use and management in the Guaporé catchment, Southern Brazil[J]. Environmental Monitoring and Assessment, 2016, 188: 643. DOI:10.1007/s10661-016-5650-3 |
| [10] | Zhu X H, Zeng Y, Huang J S, et al. Phosphorus fertilizer effect in sugarcane red soil and its loss risk assessment under different phosphorus application rates[J]. Agricultural Science & Technology, 2017, 18(12): 2372–2377. |
| [11] |
卜玉山, Magdoff F R. 十种土壤有效磷测定方法的比较[J].
土壤学报, 2003, 40(1): 140–146.
Bu Y S, Magdoff F R. A comparison of ten methods for determination of available phosphorus in soils[J]. Acta Pedologica Sinica, 2003, 40(1): 140–146. DOI:10.3321/j.issn:0564-3929.2003.01.020 |
| [12] | Hesketh N, Brookes P C. Development of an indicator for risk of phosphorus leaching[J]. Journal of Environmental Quality, 2000, 29: 105–110. |
| [13] | Pote D H, Daniel T C, Sharpley A N, et al. Relating extractable soil phosphorous to phosphorous losses in runoff[J]. Soil Science Society of America Journal, 1996, 60: 855–859. DOI:10.2136/sssaj1996.03615995006000030025x |
| [14] |
刘方, 黄昌勇, 何腾兵, 等. 长期施肥下黄壤旱地磷对水环境的影响及其风险评价[J].
土壤学报, 2003, 40(6): 838–844.
Liu F, Huang C Y, He T B, et al. The environmental impact of phosphorus on water by a long-term applying fertilizer P in the upland fields of yellow soil areas and its risks evaluation[J]. Acta Pedologica Sinica, 2003, 40(6): 838–844. DOI:10.3321/j.issn:0564-3929.2003.06.006 |
| [15] | Zhao X R, Zhong X Y, Bao H J, et al. Relating soil P concentrations at which P movement occurs to soil properties in Chinese agricultural soils[J]. Geoderma, 2007, 142: 237–244. DOI:10.1016/j.geoderma.2007.07.012 |
| [16] | Bai Z H, Li H G, Yang X Y, et al. The critical soil P levels for crop yield, soil fertility and environmental safety in different soil types[J]. Plant and Soil, 2013, 372: 27–37. DOI:10.1007/s11104-013-1696-y |
| [17] |
钟晓英, 赵小蓉, 鲍华军, 等. 我国23个土壤磷素淋失风险评估Ⅰ. 淋失临界值[J].
生态学报, 2004, (10): 2275–2280.
Zhong X Y, Zhao X R, Bao H J, et al. The evaluation of phosphorus leaching risk of 23 Chinese soils I. Leaching criterion[J]. Acta Ecologica Sinica, 2004, (10): 2275–2280. DOI:10.3321/j.issn:1000-0933.2004.10.028 |
| [18] |
黄绍敏, 郭斗斗, 张水清. 长期施用有机肥和过磷酸钙对潮土有效磷积累与淋溶的影响[J].
应用生态学报, 2011, 22(1): 93–98.
Huang S M, Guo D D, Zhang S H. Effects of long-term application of organic fertilizer and superphosphate on accumulation and leaching of Olsen-P in fluvo-aquic soil[J]. Chinese Journal of Applied Ecology, 2011, 22(1): 93–98. |
| [19] |
农业部. 到2020年化肥使用量零增长行动方案 [Z/OL]. 农农发〔2015〕2号, http://jiuban.moa.gov.cn-zwllm/tzgg/tz/201503/t20150318_4444765.htm,2015-3-18/2018-05-01.
Ministry of Agriculture, China. Action plan for zero increase in application of chemical fertilizer by 2020 [Z/OL]. http://jiuban.moa.gov.cn-zwllm/tzgg/tz/201503/t20150318_4444765.htm,2015-3-18/2018-05-01. |
| [20] | Huang S M, Ma Y, Bao D, et al. Manures behave similar to superphosphate in phosphorus accumulation in long-term field soils[J]. International Journal of Plant Production, 2011, 5(2): 135–146. |
| [21] |
鲁如坤. 土壤农业化学分析方法[M]. 北京: 中国农业科学技术出版社, 2000.
Lu R K. Analysis method of soil and agricultural chemistry[M]. Beijing: China Agricultural Science and Technology Press, 2000. |
| [22] | Wang Y T, Zhang T Q, O’Halloran I P, et al. A phosphorus sorption index and its use to estimate leaching of dissolved phosphorus from agricultural soils in Ontario[J]. Geoderma, 2016, 274: 79–87. DOI:10.1016/j.geoderma.2016.04.002 |
| [23] |
夏文建, 梁国庆, 周卫, 等. 长期施肥条件下石灰性潮土磷的吸附解吸特征[J].
植物营养与肥料学报, 2008, 14(3): 431–438.
Xia W J, Liang G Q, Zhou W, et al. Adsorption and desorption characteristics of soil phosphorus in calcareous fluvo-aquic soil under long-term fertilization[J]. Plant Nutrition and Fertilizer Science, 2008, 14(3): 431–438. DOI:10.3321/j.issn:1008-505X.2008.03.004 |
| [24] |
刘远金, 卢瑛, 陈俊林, 等. 广州城郊菜地土壤磷素特征及流失风险分析[J].
土壤与环境, 2002, 11(3): 237–240.
Liu Y J, Lu Y, Chen J L, et al. Phosphorus characteristics and loss risk assessment of vegetable garden soils in the suburbs of Guangzhou city[J]. Soil and Environmental Science, 2002, 11(3): 237–240. DOI:10.3969/j.issn.1674-5906.2002.03.004 |
| [25] |
戚瑞生, 党廷辉, 杨绍琼, 等. 长期定位施肥对土壤磷素吸持特性与淋失突变点影响的研究[J].
土壤通报, 2012, 43(5): 1187–1194.
Qi R S, Dang T H, Yang S Q, et al. The impact on soil phosphorus adsorption characteristics and leaching change point under long-term fertilization[J]. Chinese Journal of Soil Science, 2012, 43(5): 1187–1194. |
| [26] | Sibbesen E, Sharpley A N. Setting and justifying upper critical limits for phosphorous in soils[A]. Tunney H, Carton O T, Brookes P C, Johnston A E. Phosphorus loss from soil to water[M]. New York: CAB International, 1998.151–176. |
| [27] |
郭斗斗, 黄绍敏, 张水清, 等. 潮土小麦和玉米Olsen-P农学阈值及其差异分析[J].
植物营养与肥料学报, 2017, 23(5): 1184–1190.
Guo D D, Huang S M, Zhang S H, et al. Threshold values of soil Olsen-P for maize and wheat in fluvo-aquic soil[J]. Journal of Plant Nutrition and Fertilizer, 2017, 23(5): 1184–1190. |
| [28] | Jalali M, Jalali M. Assessment risk of phosphorus leaching from calcareous soils using soil test phosphorus[J]. Chemosphere, 2017, 171: 106–117. DOI:10.1016/j.chemosphere.2016.12.042 |
| [29] |
赵小蓉, 钟晓英, 李贵桐, 等. 我国23个土壤磷素淋失风险评估Ⅱ.淋失临界值与土壤理化性质和磷吸附特性的关系[J].
生态学报, 2006, 26(9): 3011–3017.
Zhao X R, Zhong X Y, Li G T, et al. The evaluation of phosphorus leaching risk of 23 Chinese soils II. The relationships between soil properties, P adsorption characteristics and the leaching criterion[J]. Acta Ecologica Sinica, 2006, 26(9): 3011–3017. DOI:10.3321/j.issn:1000-0933.2006.09.029 |
| [30] | Fortune S, Lu J, Addiscott T M, et al. Assessment of phosphorus leaching losses from arable land[J]. Plant and Soil, 2005, 269: 99–108. DOI:10.1007/s11104-004-1659-4 |
| [31] | Kang J, Hesterberg D, Osmond D L. Soil organic matter effects on phosphorus sorption: a path analysis[J]. Soil Science Society of America Journal, 2009, 73: 360–366. DOI:10.2136/sssaj2008.0113 |
| [32] | Dou Z, Ramberg C F, Toth J D, et al. Phosphorus speciation and sorption-desorption characteristics in heavily manured soils[J]. Soil Science Society of America Journal, 2009, 73: 93–101. DOI:10.2136/sssaj2007.0416 |
| [33] | Gérard F. Clay minerals, iron/aluminum oxides, and their contribution to phosphate sorption in soils—a myth revisited[J]. Geoderma, 2016, 262: 213–226. DOI:10.1016/j.geoderma.2015.08.036 |
| [34] | Brookes P C, Heckrath G, de Smet J, et al. Losses of phosphorus in drainage water[A]. Tunney H, Carton O T, Brookes P C, et al. Phosphorus loss from soil to water [M]. UK: Biddles Ltd, Guildford & King’s Lynn, 1998. 253–271. |
| [35] | Sims J T. Phosphorous soil testing: Innovations for water quality protection[J]. Communications in Soil Science and Plant Analysis, 1998, 29(11-14): 1471–1489. DOI:10.1080/00103629809370044 |
| [36] | Heckrath G, Brookes P C, Poulton P R, et al. Phosphorus leaching from soil containing different phosphorus concentrations in the Broadbalk experiment[J]. Journal of Environmental Quality, 1995, 24: 904–910. |
 2018, Vol. 24
  doi:
doi: 

