2. 全国农业技术推广服务中心,北京 100026
2. National Agricultural Technology Extension Service Center, Beijing 100026, China
土壤肥力是农业生产的基础[1],土壤肥力的高低直接影响着作物生长,影响着农业生产的结构[2]。土壤养分是土壤肥力的核心部分,土壤养分的演变分析有助于了解区域土壤肥力变化情况和变化规律,对稳定粮食产量具有重要意义[3]。潮土地区地势平坦、土层深厚、生产性状良好、适种性广[4]。潮土约占全国耕地面积的15.9%,是我国小麦和玉米等粮食作物的主产区[5]。潮土区土壤养分含量的变化在一些地区和时间段的研究已有一些报道,如钦绳武等[6]分析了河南省封丘县潮土区1988—1992年来土壤肥力的变化特征,发现土壤有机质、全氮、全磷、全钾、速效氮、速效磷含量均有所上升,速效钾含量有所下降;张金涛等[7]调查了全国潮土区1987—2006年的土壤肥力状况,发现土壤有机质和全氮含量有所增加,土壤pH值降低0.28个单位;杨玉建等[8]在山东省禹城市的土壤有机质含量研究结果表明,禹城市2003年土壤有机质含量比1980年增加了8.68 g/kg,年均提高0.38 g/kg。虽然这些研究为潮土肥力的演变提供了有价值的参考,但研究地点分散,且时间较短,不足以为国家层面的决策提供依据。所以本文在分析29年来潮土养分现状和定量演变趋势的基础上,进一步分析了土壤肥力演变的影响因素及其演变过程的贡献因子,为潮土区耕地质量管理和肥料施用提供科学依据[9-12]。
1 材料与方法 1.1 试验区概况国家级潮土长期监测点主要分布在北京 (8个)、天津 (8个)、河北 (5个)、山西 (2个)、内蒙 (2个)、江苏 (6个)、安徽 (3个)、山东 (2个)、河南 (11个)、湖北 (5个)、湖南 (2个)、新疆 (3个) 等12个省份。监测点中大部分建于1988年,后期在1997年和2004年分别新增了一些监测点。至2016年,监测时间最长的点已经有29年的历史。
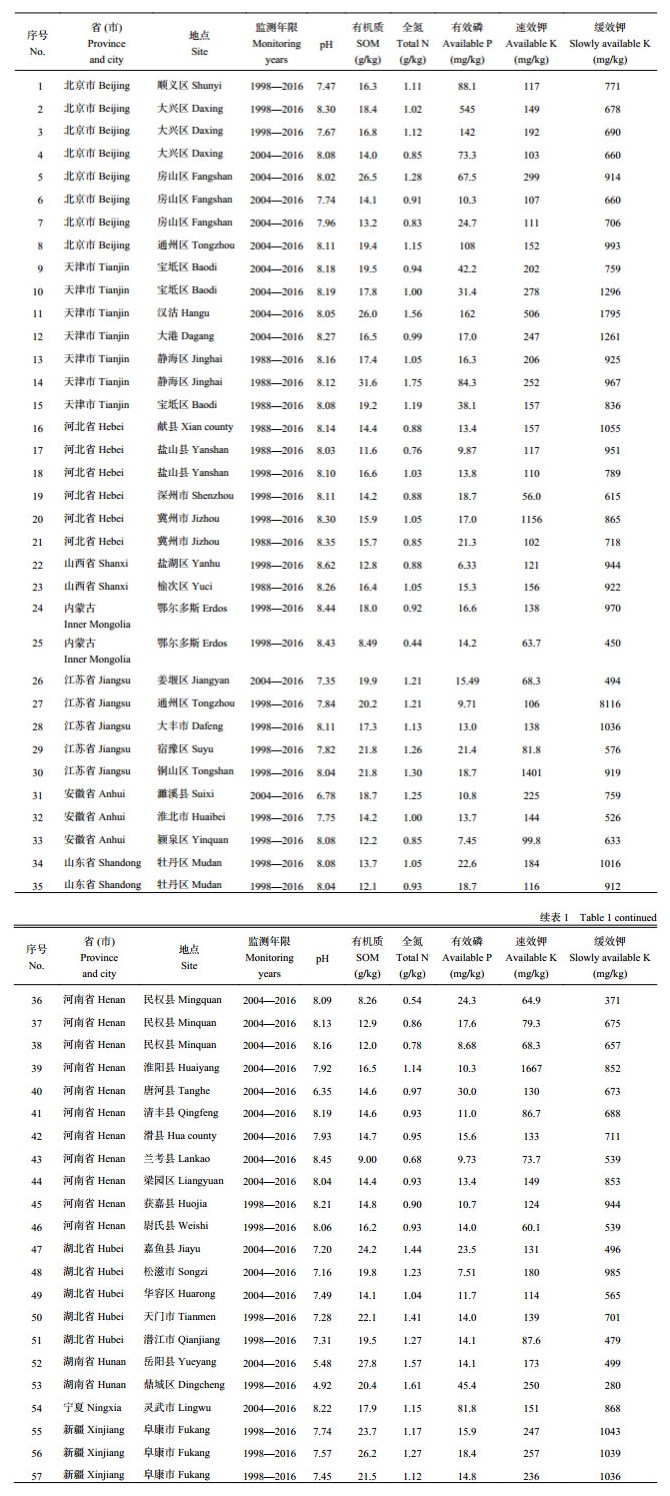
潮土监测区种植的作物主要为小麦和玉米,种植制度为一年两熟制,主要以小麦−玉米、冬小麦−夏玉米、春小麦−夏玉米等轮作方式为主。监测区采用机械化耕种为主。监测点耕层 (0—20 cm) 土壤初始性质见表1。
| 表1 监测点起止年限及初始耕层 (0—20 cm) 土壤基本性质 Table 1 Periods of monitoring sites and the initial basic properties of fluvo-aquic soil |
 |
每个监测点设置对照 (不施肥) 和常规施肥 (农民习惯施肥) 两个处理,依照当地农民习惯进行水肥管理等农事活动,并定位记载施肥量、肥料种类、作物产量以及管理措施等信息。每季作物收获后,采集耕层 (0—20 cm) 土壤样品,测定土壤有机质、全氮、有效磷、速效钾及pH值等土壤肥力指标。土壤养分测定采用常规分析方法[13]。
1.3 数据处理试验数据用Excel 2016整理,运用Sigmaplot 12.5和SPSS 17.0 进行相关性分析及显著性检验。为避免个别年份点位差异对土壤养分的演变规律造成影响,因此,按照建点的时间将57个监测点划分为监测初期 (1988—1997年)、监测中期 (1998—2003 年) 和监测后期 (2004—2016年) 3个阶段。本研究中所涉及的土壤养分演变趋势的数据 (盒形图) 均以每组数据的中值表示[14],采用SPSS17.0[15]的方法进行主成分分析。
2 结果与分析 2.1 土壤养分演变特征监测初期 (1988—1997年)、中期 (1998—2003年) 和近期 (2004—2016年) 土壤有机质、全氮、有效磷、速效钾含量、pH值的含量变化,以及三个时期平均值的比较见图1。
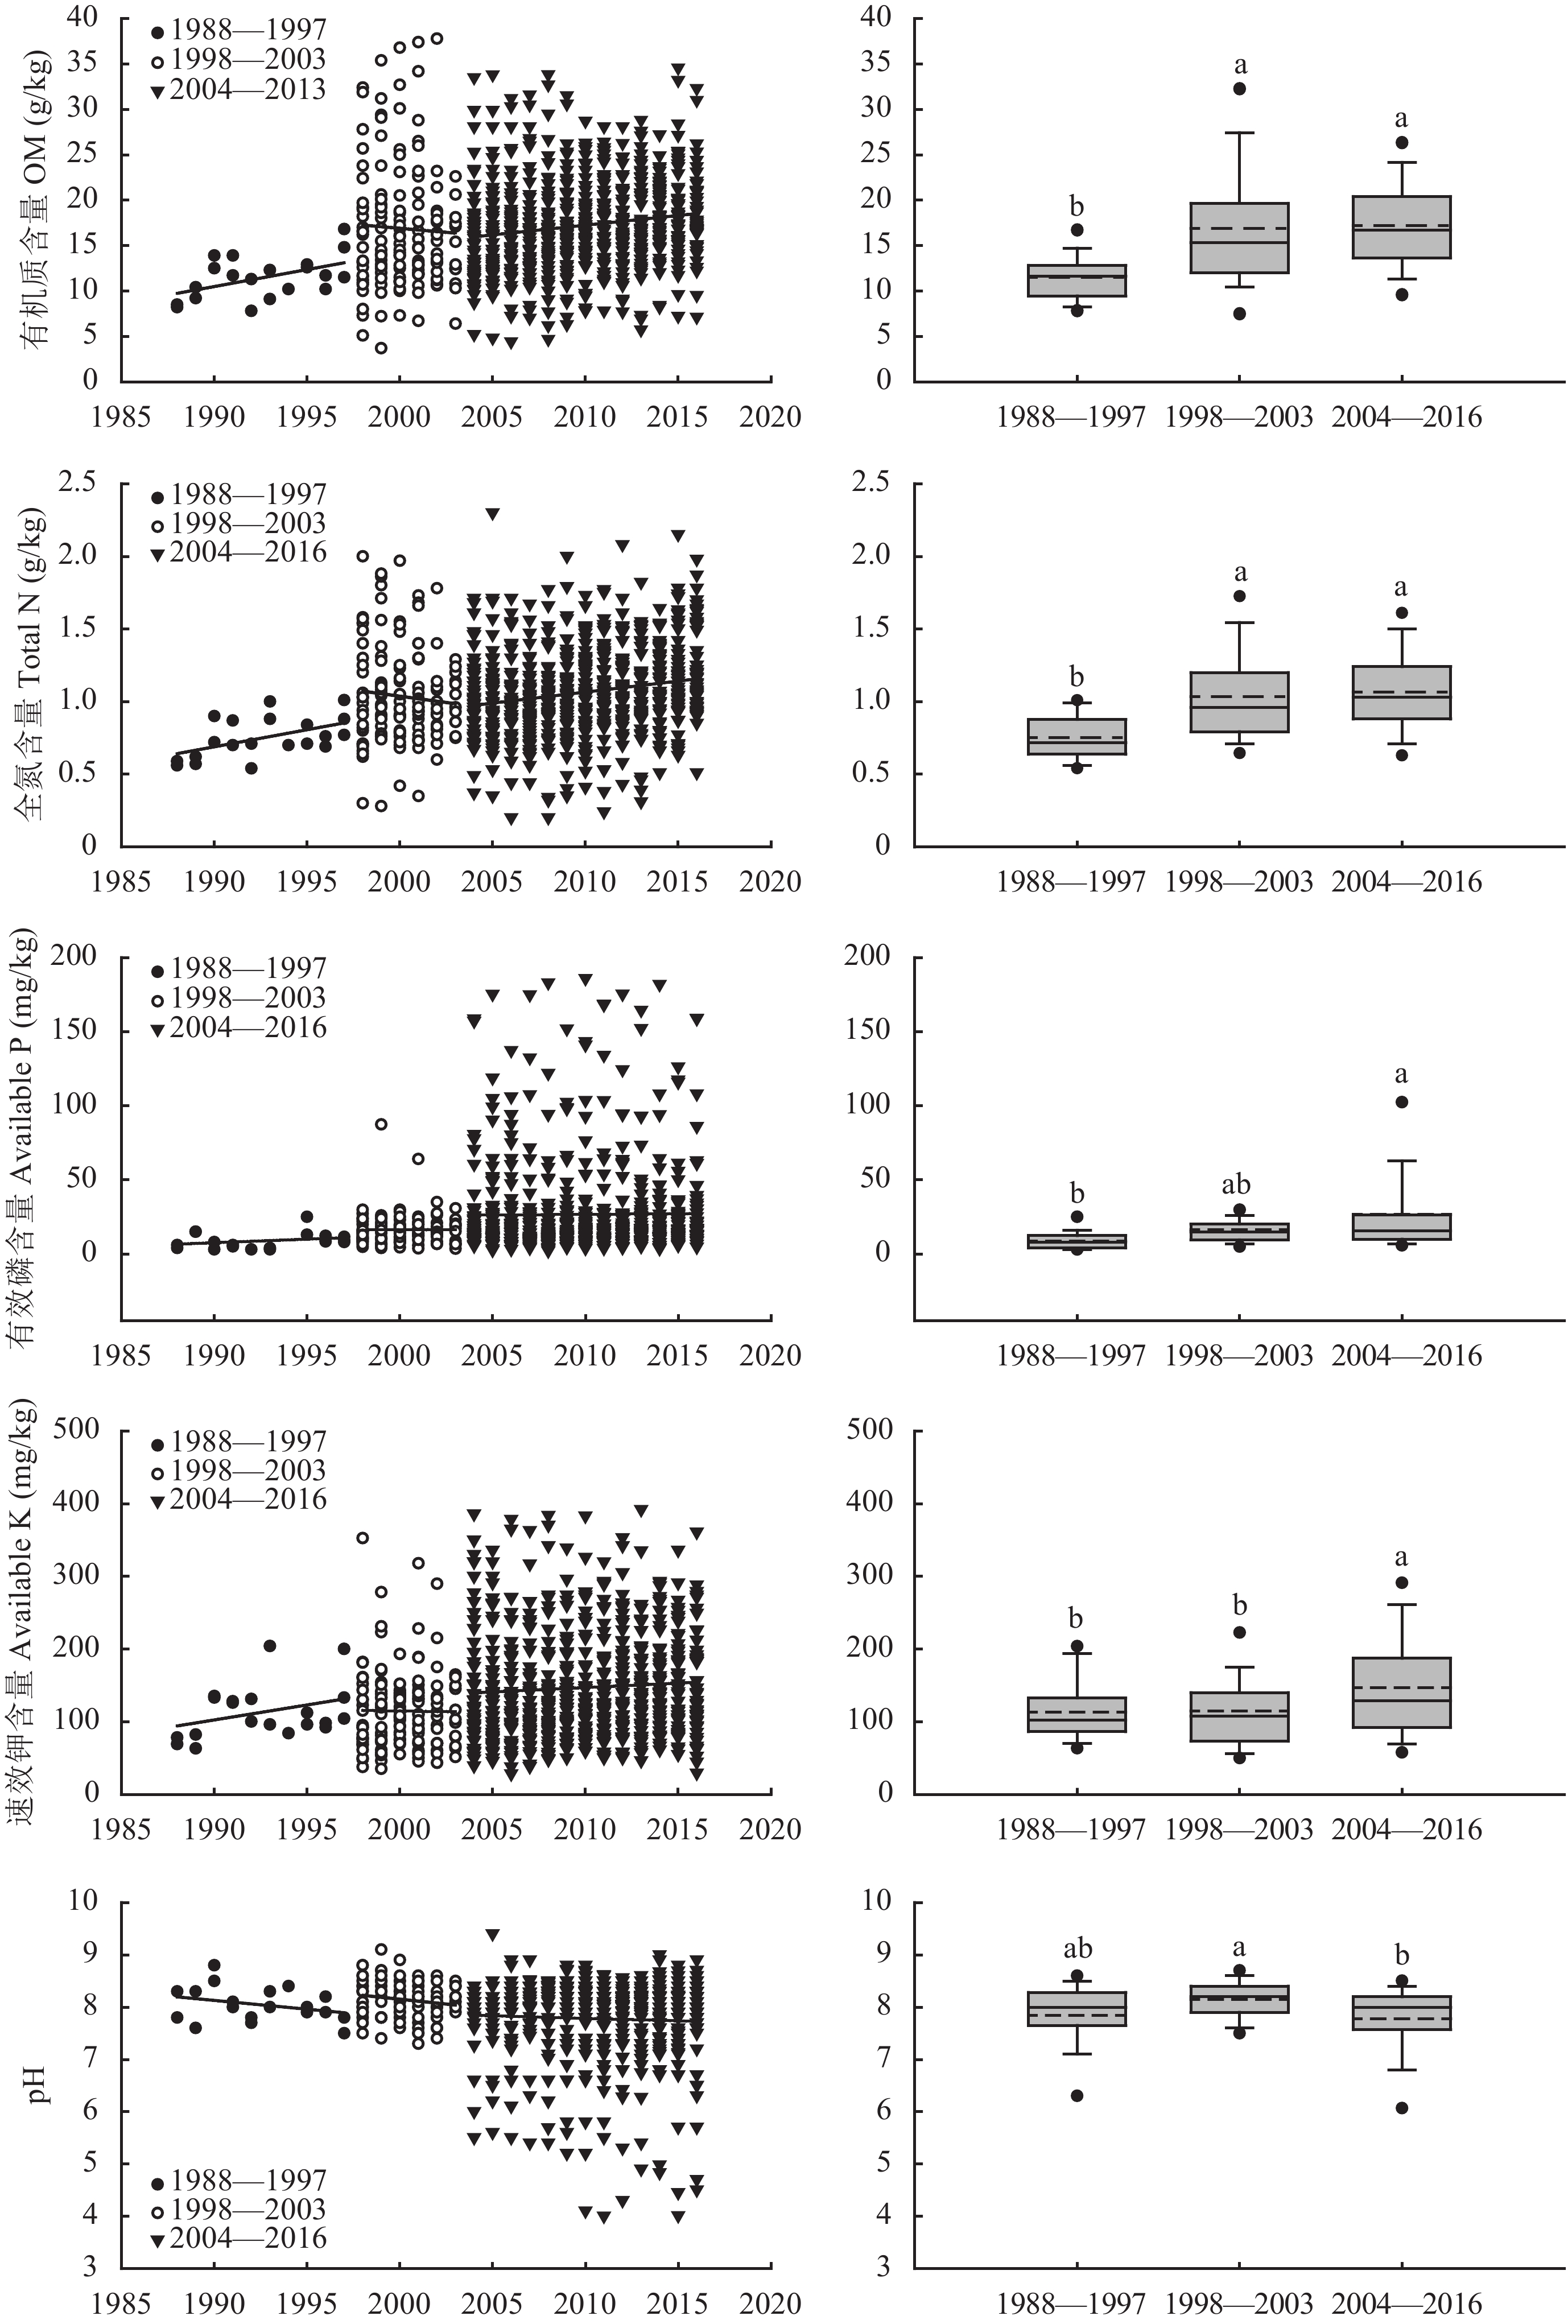 |
| 图1 潮土土壤肥力要素演变趋势 Fig. 1 Changes of fertility factors in fluvo-aquic soil at different monitoring periods [注(Note):盒式图下边缘线和上边缘线分别代表全部数据的 5% 和 95%,上下实心点为异常值;矩形盒上、下边缘分别代表上四分位数和下四分位数,分别代表全部数据的 75% 和 25%;盒中实线代表中值,虚线代表平均值;矩形盒上的不同字母表示不同监测时期在 5% 水平上差异显著 The lower and upper edge lines represent the 5% and 95% of the data, the solid points represent the vertical outliers. The lower and upper quartiles of the boxplots represent 25% and 75% of data, and the solid lines represent the median values and the dash lines represent the average values. Different letters above the boxplot indicate significant differences among the three mentoring periods at 0.05 level.] |
潮土区土壤有机质含量总体呈上升趋势,土壤有机质含量范围在3.70~37.8 g/kg。监测初期和监测后期土壤有机质含量呈上升趋势,监测中期略有下降。监测初期土壤有机质平均含量为11.5 g/kg,监测中期为16.9 g/kg,监测后期为17.2 g/kg。监测初期到监测中期呈显著上升趋势 (P < 0.05),提升了47.1%,从监测中期到监测后期,虽然也呈升高趋势,但未达到显著水平。
2.1.2 土壤全氮土壤全氮含量变化与有机质变化相似,整体呈现上升的趋势。监测前期、监测中期和监测后期土壤全氮含量分别为0.75、1.03和1.06 g/kg,从监测初期到监测中期土壤全氮平均含量呈显著上升趋势 (P < 0.05),与监测初期相比显著提升37.8%。而从监测中期到监测后期增加未达到显著水平。
2.1.3 土壤有效磷监测区土壤有效磷含量范围为1.99~185.80 mg/kg。三个监测阶段土壤有效磷含量均呈上升趋势,监测初期土壤有效磷含量为8.67 mg/kg,监测中期虽略有升高,但增加不显著。从监测中期到监测后期土壤有效磷继续增加,虽然监测后期与中期有效磷含量差异未达到显著水平,但比监测初期有了显著增加 (P < 0.05),提高了226%。
2.1.4 土壤速效钾土壤速效钾含量监测前期和监测后期各试验点呈上升趋势,在监测中期各监测点变异较大。监测初期到监测中期土壤速效钾含量平均值略有升高,但未达到显著水平。从监测中期到监测后期呈显著上升趋势 (P < 0.05),监测后期土壤速效钾的平均含量比监测中期上升了30.4%。
2.1.5 土壤pH土壤pH水平在4.00~9.40之间,各监测期间都有下降的趋势,监测初期与中期接近,从监测中期 (8.14) 到监测后期 (7.78),土壤pH呈显著下降趋势 (P < 0.05)。
2.2 作物产量演变特征常规施肥下,小麦与玉米的产量均高于不施肥处理,而且变化趋势与不施肥处理也不同 (图2),与监测初期相比,潮土常规施肥条件下小麦和玉米产量呈显著增加趋势,无肥区小麦产量平均值为1773 kg/hm2,常规施肥区的平均产量为6008 kg/hm2。小麦常规施肥区产量较无肥区增加238%。无肥区玉米平均产量为2393 kg/hm2,常规施肥区平均产量为7281 kg/hm2。常规施肥区玉米平均产量较无肥区增产204%,潮土区施肥措施具有显著的增产作用。
 |
| 图2 常规施肥与不施肥处理的小麦和玉米产量变化 Fig. 2 Yield changes of wheat and corn under conventional fertilization and no fertilization [注(Note):矩形盒中下边缘线和上边缘线分别代表全部数据的 5% 和 95%,上下实心点为异常值。矩形盒上、下边缘分别代表上四分位数和下四分位数,分别代表全部数据的 75% 和 25%,实线代表中值,虚线代表平均值;矩形盒上的不同字母表示不同监测时期在 5% 水平上差异显著 The lower and upper edge lines represent the 5% and 95% of the data, the solid points represent the vertical outliers. The lower and upper quartiles of the boxplots represent 25% and 75% of data, the solid lines represent the median values and the dash lines represent the average values; Different letters above the boxplot indicate significant differences among the three mentoring periods at 0.05 level.] |
分别统计三个监测阶段施肥条件下的作物产量 (图3),小麦产量监测初期 (1988—1997) 平均为2902 kg/hm2,监测中期 (1998—2003) 和监测后期 (2004—2016) 小麦产量平均值与监测初期相比显著上升 (P < 0.05),分别上升了87.6%和114%。而从监测中期到监测后期呈上升趋势,但未达到显著水平。玉米产量的变化与小麦一样,从监测初期到监测中期,上升趋势明显 ( P < 0.05),显著提升了111%。从监测中期到监测后期增加不显著。
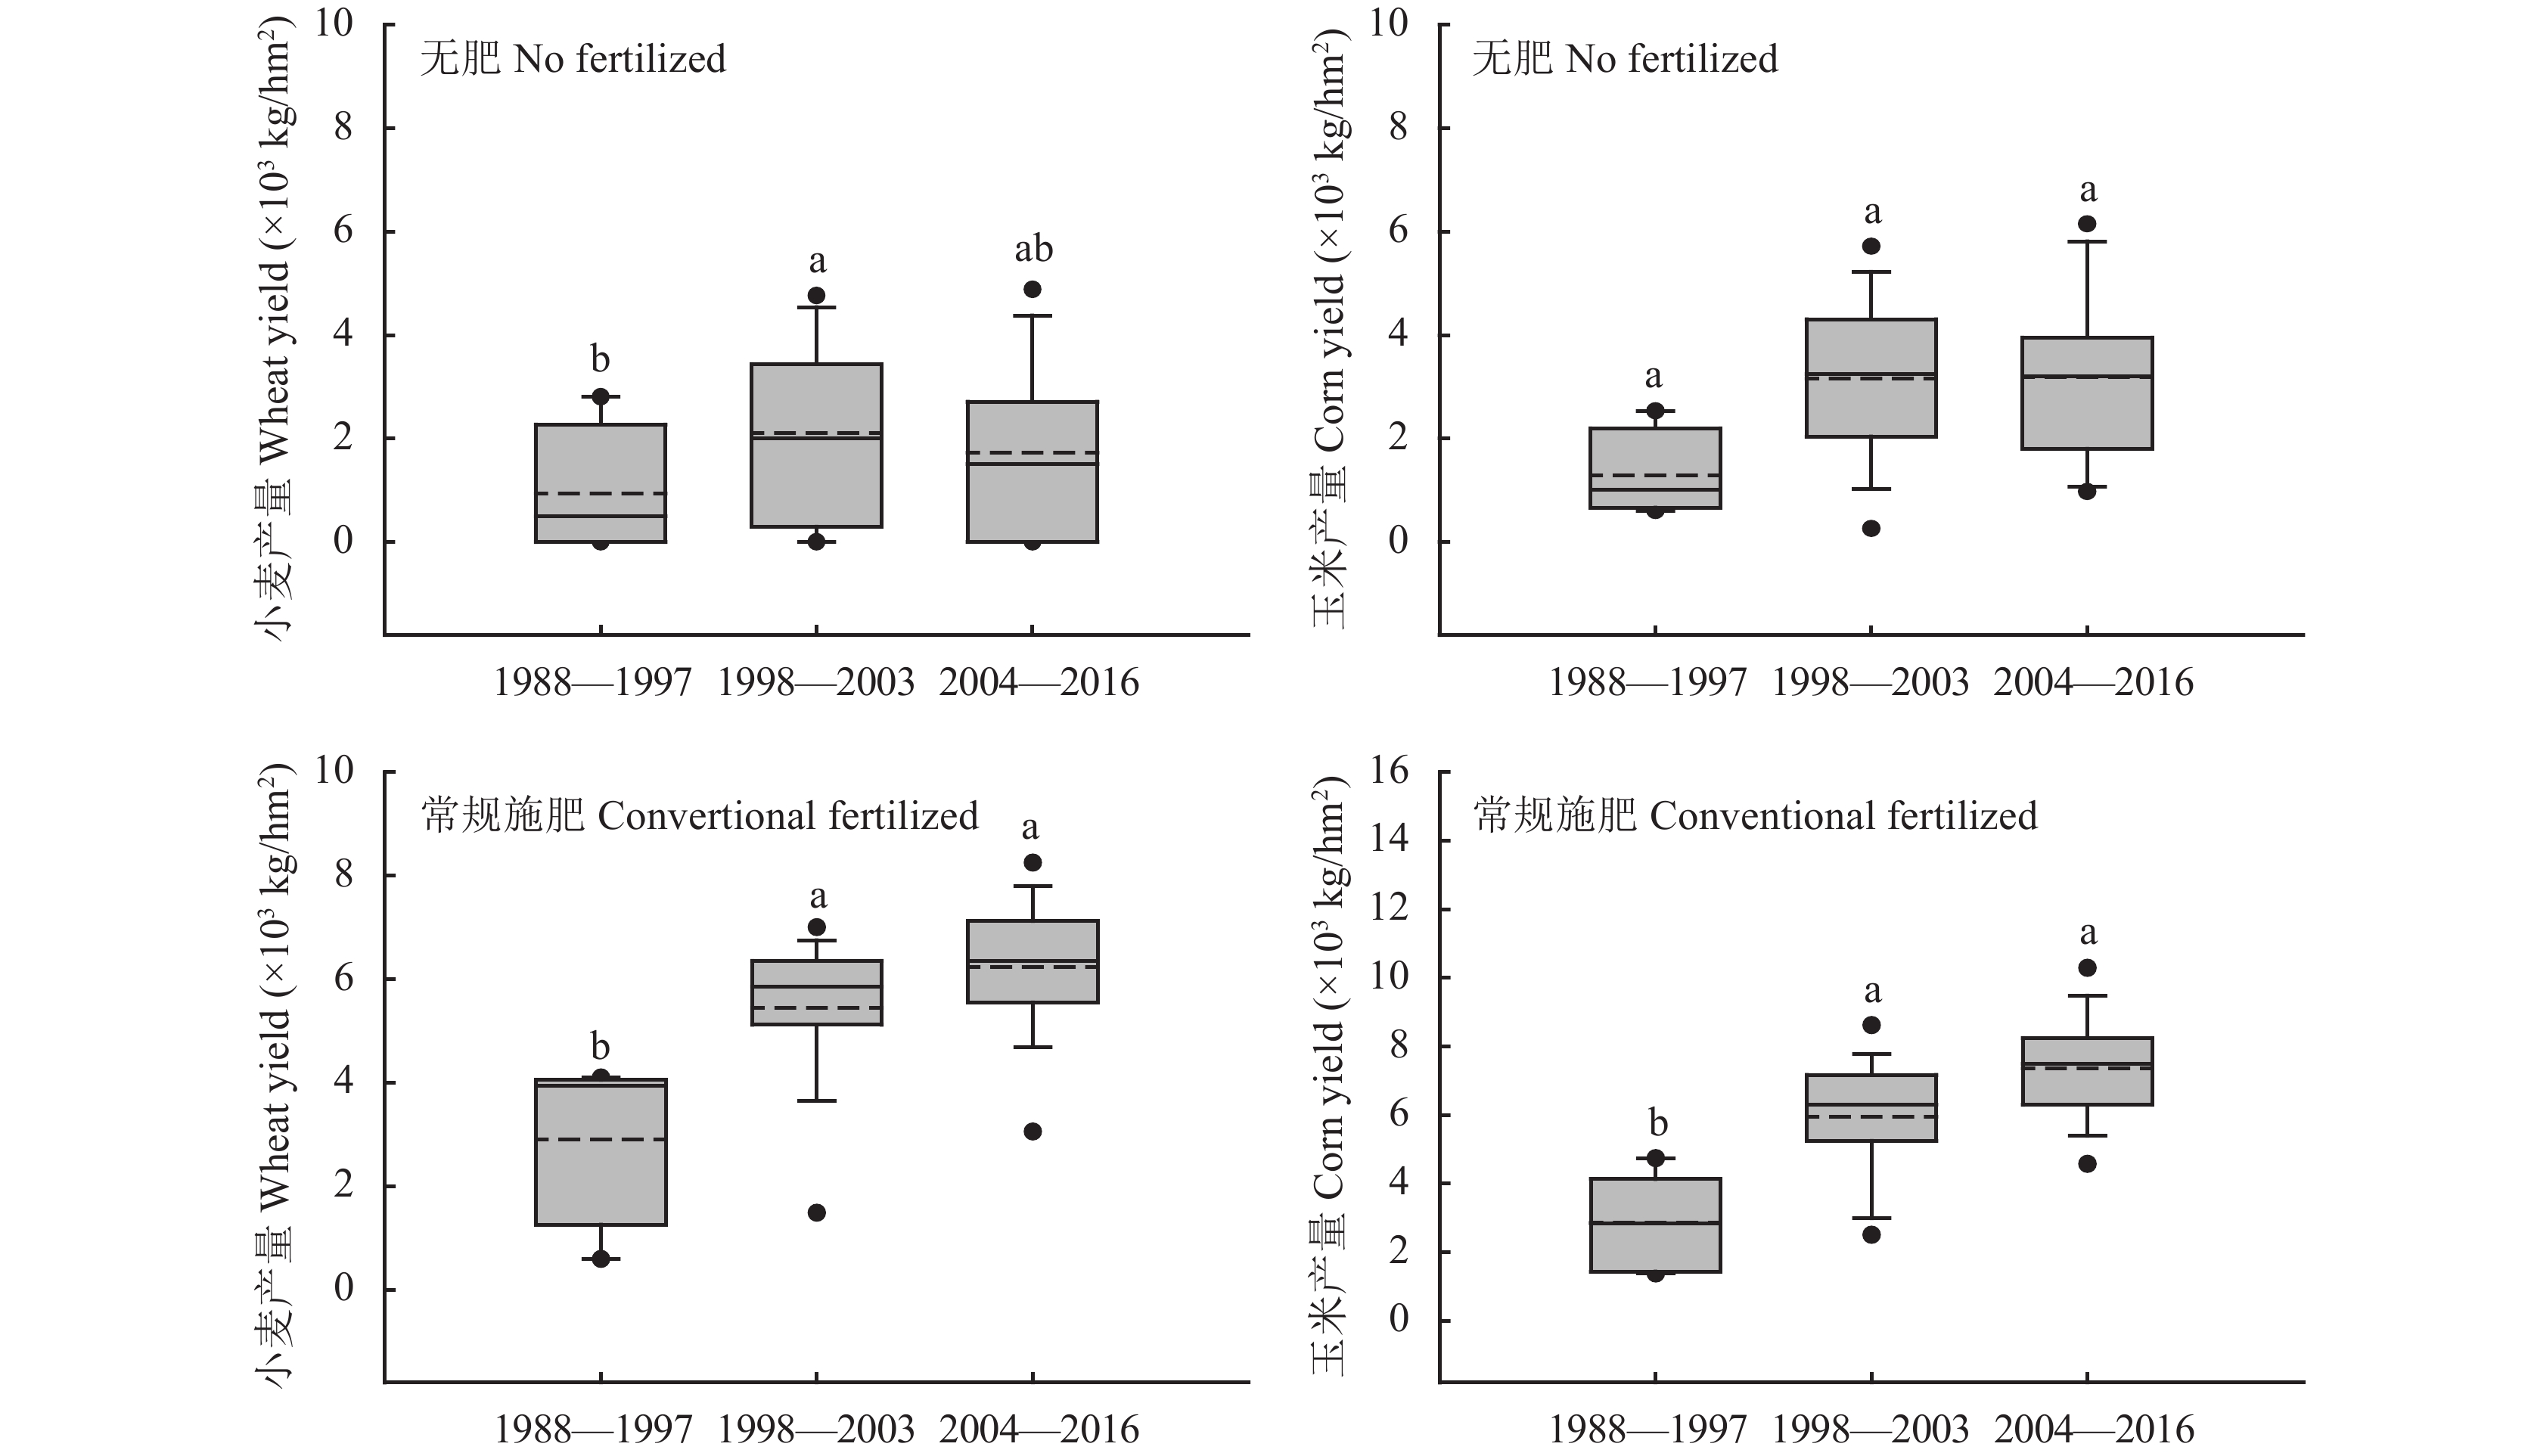 |
| 图3 不施肥处理与常规施肥处理下小麦和玉米产量的阶段性变化 Fig. 3 Periodical change of yields of wheat and corn under non-fertilized treatments and conventional fertilized treatments [注(Note):盒式图下边缘线和上边缘线分别代表全部数据的 5% 和 95%,上下实心点为异常值;矩形盒上、下边缘分别代表上四分位数和下四分位数,分别代表全部数据的 75% 和 25%;盒中实线代表中值,虚线代表平均值;矩形盒上的不同字母表示不同监测时期在 5% 水平上差异显著 The lower and upper edge lines represent the 5% and 95% of the data, the solid points represent the vertical outliers. The lower and upper quartiles of the boxplots represent 25% and 75% of data, and the solid lines represent the median values and the dash lines represent the average values. Different letters above the boxplot indicate significant differences among the three mentoring periods at 0.05 level.] |
常规施肥与不施肥处理相比,小麦和玉米的增产量随种植年限的增加都呈升高的趋势。小麦增产量监测初期 (1988—1997年) 为1971 kg/hm2,之后逐渐升高,监测中期 (1998—2003年) 的增产量为3342 kg/hm2,监测后期 (2004—2016年) 达到最高值4514 kg/hm2,其增产率最高,达到了261%。玉米增产量在监测初期 (1988—1997年) 为1143 kg/hm2,监测中期增产量为2937 kg/hm2,监测后期 (2004—2016年) 达到最高值4246 kg/hm2,其增产率为123%。
2.3 土壤肥力因素对土壤肥力变化的贡献为保证各因素间有可比性,首先对土壤pH、有机质 (SOM)、全氮 (TN)、有效磷 (AP) 和速效钾 (AK) 5个土壤肥力指标原始数据矩阵进行了标准化处理[16]。然后,运用主成分分析法计算了5个指标对土壤肥力变化的贡献 (表2)。
| 表2 主成分特征值及其在总变异方差中的占比 Table 2 Principal component eigenvalues (EV) and their proportion in total variance |
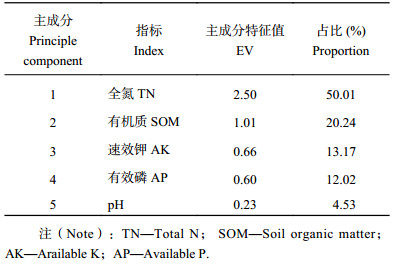 |
按照5个肥力指标得分系数从大到小排列为TN > SOM > AK > AP > pH,指标权重也以全氮最大,速效钾最小,第1和2主成分 (全氮和有机质含量) 的特征值分别为2.50和1.01,对总方差的贡献率分别为50.0%和20.3%,两者之和达到70.3%。换句话说,排在前面的两个主成分影响了土壤肥力全部变化的70.3%,是影响土壤肥力属性的关键因素。
2.3.2 土壤属性综合得分主成分是原各指标的线性组合,各指标的权数为特征向量;它表示各单项指标对于主成分的重要程度并决定了该主成分的实际意义。根据主成分计算公式,可得到2个主成分与原5项指标的线性组合如下:
| $\begin{aligned}\;{\rm{F}}1=&0.56 {\rm{TN}} +0.53 {\rm{SOM}}+0.39 {\rm{AK}}+\\&0.30 {\rm{AP}}-0.40 {\rm{pH}} \end{aligned}$ | (1) |
| $\begin{aligned}\quad{\rm{F}}2=&-0.22 {\rm{TN}}-0.10 {\rm{SOM}}+0.41 {\rm{AK}}+\\&0.41 {\rm{AP}}+0.51 {\rm{pH}} \end{aligned}$ | (2) |
综合属性得分是将标准化后的数据带入函数表达式中,计算出每个主成分的得分,然后与其对应的贡献率相乘并求和,即,F = F1 × 49.31% + F2 × 20.85%。各阶段的综合肥力属性得分如图4所示。由计算结果可以看出,1988—1997年和1998—2003年的综合属性得分分别为–0.8和–0.35,而2004—2016年的综合属性得分就增加到了0.09,说明土壤肥力在监测后期得到了改善。
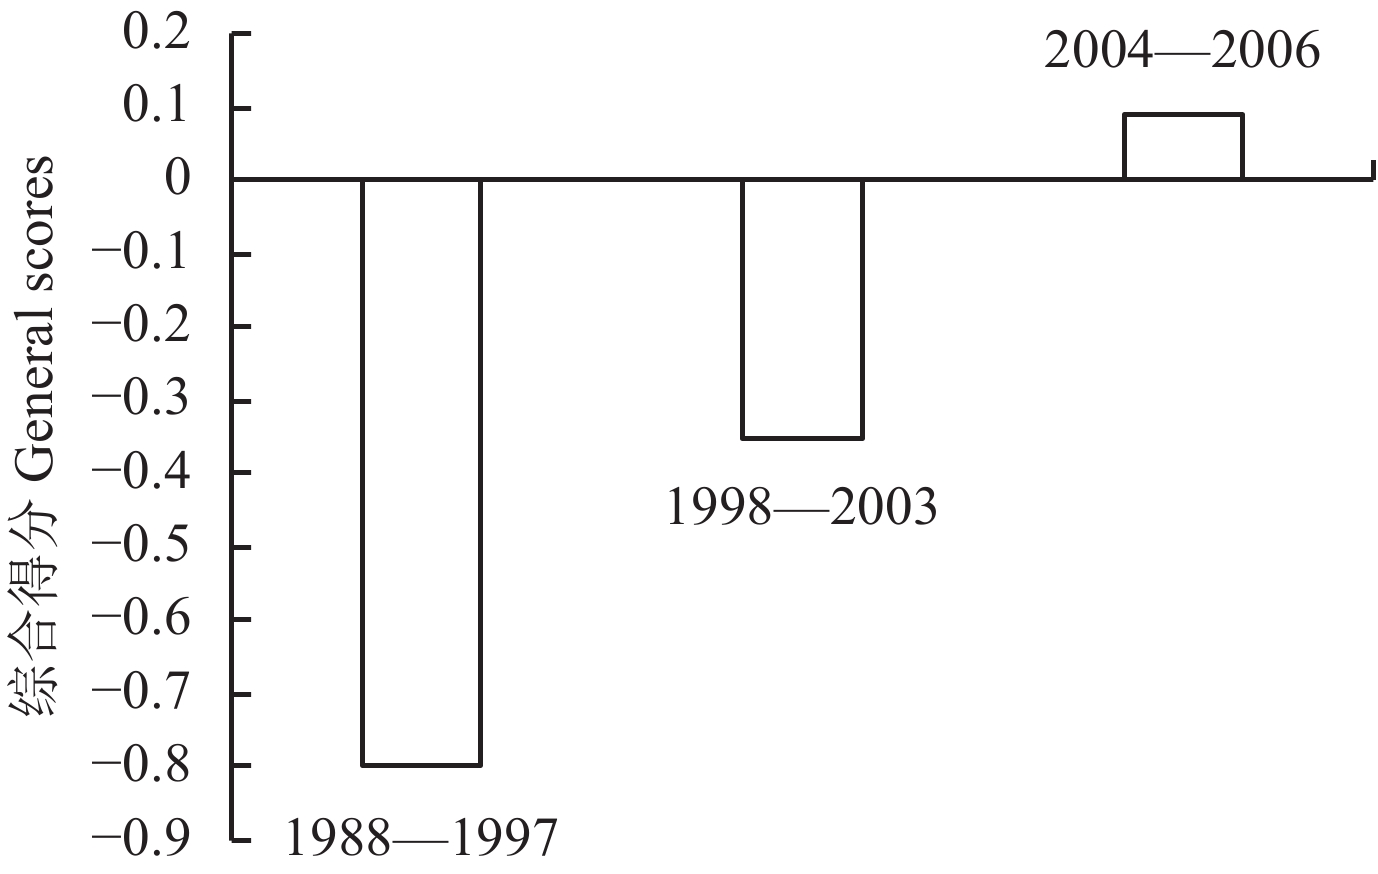 |
| 图4 不同监测阶段土壤综合肥力得分 Fig. 4 General scores of soil fertility at different monitoring periods |
综合29年来土壤养分的变化趋势来看,土壤肥力整体呈上升的趋势。除了土壤pH值外,土壤有机质、全氮、有效磷和速效钾含量基本呈上升趋势。
然而,监测的几个肥力指标的阶段性变化规律不完全一致。监测中期土壤有机质和全氮含量较监测初期有显著增加,而监测后期与监测中期没有显著变化;土壤有效磷含量则随着监测年限的延长不断增加,在监测中期,与监测初期的差异未达到显著水平,而到了监测后期,则显著高于初期;土壤速效钾含量在监测初期和中期变化不大,全氮监测后期迅速增加,与监测中期有了显著差异;土壤pH与速效钾一样,在近10年下降显著。与此相对应的是,小麦、玉米产量也与土壤有机质和全氮含量的阶段性变化出现了一致的规律性。从一个角度也证明了土壤有机质和全氮作为土壤肥力主要影响因素的作用[17-18]。
监测潮土区土壤肥力因素的阶段性变化与29年间施肥量、肥料种类和比例的变化相关[19-20]。在本研究的潮土区中肥料的种类主要有有机肥和化肥。与监测初期相比,中期和后期无机养分和总养分投入的量显著增加,特别是化肥投入量增加是影响土壤养分和土壤有机质的重要原因。在监测中期有机养分的施用量从监测初期的523 kg/hm2下降到了270 kg/hm2,导致土壤有机质和全氮在监测中期有所下降。长期施用有机肥能明显提高土壤中有机质含量,且有机质的增加量和年限之间具有良好的正相关性[7]。土壤有机质含量的变化及变化量的大小与肥料类型、施用量和土壤性质有关[21-24]。本研究中有机质含量29年来增加了10.02 g/kg。1988—2016年监测点总养分的施用量呈上升的趋势,特别是化肥。三个监测阶段总养分的施用量分别为690、813和865 kg/hm2。1998—2003年土壤有机质略有下降,可能与有机养分的施用量下降有关。
此外,潮土pH呈现下降的趋势,经过29年长期常规施肥,潮土的pH下降了3.99%。结果显示,过量施用氮肥是华北平原潮土pH值下降的重要原因[25]。本研究结果表明,潮土pH随着时间呈下降的趋势,土壤全氮随时间的增长呈增加的趋势,可能是由于化学氮肥在土壤中转化为铵态氮,铵态氮的硝化作用引起的[26–27]。因此,潮土培肥应该注意合理平衡增施有机肥,重视秸秆还田,适当减少氮、磷肥的施用[28]。
3.2 作物产量变化作物产量受土壤条件、气候因素、施肥措施、作物品种与管理等多种因素的影响[29]。本研究表明作物产量主要受土壤肥力和施肥的影响。长期常规施肥条件下,潮土小麦和玉米产量呈增加的趋势,通过对土壤养分含量与作物产量之间的相关性分析,结果表明作物产量与土壤养分含量呈显著的线性相关。施肥是作物获得高产的重要措施之一,也是影响土壤肥力因素变化很重要的因素[30]。年投入总养分、有机养分、无机养分量分别为851、192和659 kg/hm2,N∶P2O5∶K2O = 1∶0.23∶0.77。磷、钾的投入偏低,但土壤有效磷呈明显的上升趋势,这可能与小麦和玉米带走磷量较少有关[31]。
从玉米和小麦产量年度变化可以看出,小麦产量的增产幅度明显大于玉米。这可能是大部分肥料都在小麦播种时施入,小麦季养分供应充足,而在玉米季有部分监测点只施入化学氮肥,不施磷钾肥[31]。三个监测阶段N∶P2O5∶K2O分别为1∶0.60∶0.56、1∶0.58∶0.36和1∶0.43∶0.33。磷和钾的量远低于氮的量。磷钾的缺乏可能是影响其产量的主要原因,对于小麦和玉米,肥料中的磷对产量的影响均较大,所以需要适当提高磷肥的用量,降低氮肥的用量。
4 结论29年来,随着化肥用量的增加,潮土区土壤有机质、有效磷、全氮和速效钾含量都呈上升趋势。监测初期与监测中期氮肥用量的大幅度增加,导致土壤有机质和全氮的显著增加,而中期、后期磷肥钾肥投入量的增加,导致后期土壤有效磷和速效钾含量的显著增加。总体而言,土壤肥力在29年来已获得显著的提高。但由于长期大量氮肥的投入,导致土壤pH在监测后期的显著下降,有可能在今后成为影响作物产量的因素。
潮土区土壤全氮和有机质是土壤肥力的主要贡献因子,因此潮土培肥的主要目标是提升全氮和土壤有机质含量。
| [1] |
徐明岗, 张文菊, 黄绍敏. 中国土壤肥力演变(第二版)[M]. 北京: 中国农业科学技术出版社, 2015.
Xu M G, Zhang W J, Huang S M. Evolution of Chinese soil fertility (2nd Ed.)[M]. Beijing: China Agricultural Science and Technology Press, 2015. |
| [2] |
骆东奇, 白洁, 谢德体. 论土壤肥力评价指标和方法[J].
生态环境报, 2002, 11(2): 202–205.
Luo D Q, Bai J, Xie D T. On the evaluation index and method of soil fertility[J]. Journal of Ecology and Environment, 2002, 11(2): 202–205. |
| [3] |
骆伯胜, 钟继洪, 陈俊坚. 土壤肥力数值化综合评价研究[J].
土壤, 2004, 36(1): 104–106.
Luo B S, Zhong J H, Chen J J. A comprehensive evaluation of soil fertility numerical evaluation[J]. Soils, 2004, 36(1): 104–106. DOI:10.3321/j.issn:0253-9829.2004.01.023 |
| [4] |
沈善敏. 中国土壤肥力[M]. 北京: 中国农业出版社, 1998.
Shen S M. Soil fertility in China[M]. Beijing: China Agriculture Press, 1998. |
| [5] |
马常宝, 卢昌艾, 任意, 等. 土壤地力和长期施肥对潮土区小麦和玉米产量演变趋势的影响[J].
植物营养与肥料学报, 2012, 18(4): 796–802.
Ma C B, Lu C A, Ren Y, et al. Effects of soil fertility and long-term fertilization on the evolution of wheat and maize yield in fluvo-aquic soil[J]. Plant Nutrition and Fertilizer Science, 2012, 18(4): 796–802. |
| [6] |
钦绳武, 顾益初, 朱兆良. 潮土肥力演变与施肥作用的长期定位试验初报[J].
土壤学报, 1998, (3): 367–375.
Qin S W, Gu Y C, Zhu Z L. Preliminary report on long-term localization of tidal soil fertility evolution and fertilization[J]. Acta Pedologica Sinica, 1998, (3): 367–375. DOI:10.3321/j.issn:0564-3929.1998.03.011 |
| [7] |
张金涛, 卢昌艾, 王金洲, 等. 潮土区农田土壤肥力的变化趋势[J].
中国土壤与肥料, 2010, (5): 6–10.
Zhang J T, Lu C A, Wang J Z, et al. Change trend of farmland soil fertility in fluvo-aquic soil[J]. Soil and Fertilizer Sciences in China, 2010, (5): 6–10. DOI:10.3969/j.issn.1673-6257.2010.05.002 |
| [8] |
杨玉建, 杨劲松. 潮土区土壤有机质含量的趋势演变研究—以禹城市为例[J].
土壤通报, 2005, (5): 9–13.
Yang Y J, Yang J S. Study on the trend evolution of soil organic matter content in the fluvo-aquic soil area−A case study of Yucheng City[J]. Chinese Journal of Soil Science, 2005, (5): 9–13. |
| [9] |
李建军, 辛景树, 张会民, 等. 长江中下游粮食主产区25年来稻田土壤养分演变特征[J].
植物营养与肥料学报, 2015, 21(1): 92–103.
Li J J, Xin J S, Zhang H M, et al. Evolution characteristics of soil nutrients in the main rice production regions, the middle-lower reach of Yangtze River of China[J]. Journal of Plant Nutrition and Fertilizer, 2015, 21(1): 92–103. |
| [10] |
康日峰, 任意, 吴会军, 等. 26年来东北黑土区土壤养分演变特征[J].
中国农业科学, 2016, 49(11): 2113–2125.
Kang R F, Ren Y, Wu H J, et al. Evolution characteristics of soil nutrients in black soil areas in Northeast China for 26 years[J]. Scientia Agricultura Sinica, 2016, 49(11): 2113–2125. DOI:10.3864/j.issn.0578-1752.2016.11.008 |
| [11] |
田有国, 张淑香, 刘景, 等. 褐土耕地肥力质量与作物产量的变化及影响因素分析[J].
植物营养与肥料学报, 2010, 16(1): 105–111.
Tian Y G, Zhang S X, Liu J, et al. Changes in fertility quality and crop yield and their influencing factors in cinnamon soil[J]. Plant Nutritionand Fertilizer Science, 2010, 16(1): 105–111. |
| [12] |
李彦, 孙翠平, 井永苹, 等. 长期施用有机肥对潮土土壤肥力及硝态氮运移规律的影响[J].
农业环境科学学报, 2017, 36(7): 1386–1394.
Li Y, Sun C P, Jing Y P, et al. Effects of long-term application of organic manure on soil fertility and nitrate-nitrogen transport in fluvo-aquic soil[J]. Journal of Agro-Environment Science, 2017, 36(7): 1386–1394. |
| [13] |
陈赫, 韩晓日, 杨劲峰, 等. 长期施肥土壤有机碳含量与气候因子的相关性研究[J].
土壤通报, 2010, 4l(3): 522–526.
Chen H, Han X R, Yang J F, et a1. The correlation of soil organic carbon content of long-term fertilization and climate factors[J]. Chinese Journal of Soil Science, 2010, 4l(3): 522–526. |
| [14] |
张水清, 杨莉, 黄绍敏, 等. 长期施肥下潮土速效钾含量与钾素投入水平关系[J].
植物营养与肥料学报, 2014, 20(3): 773–777.
Zhang S Q, Yang L, Huang S M, et al. Relationship between available potassium content and potassium input level in tidal soil under long-term fertilization[J]. Journal of Plant Nutrition and Fertilizer, 2014, 20(3): 773–777. |
| [15] | Kunzova E, Hejcman M. Yield development of winter wheat over 50 years of nitrogen, phosphorus and potassium application on greyic Phaeozem in the Czech Republic[J]. European Journal of Agronomy, 2010, 33: 166–174. DOI:10.1016/j.eja.2010.05.002 |
| [16] |
高伟, 杨军, 任顺荣,等. 长期定位肥料对土壤肥力和作物产量的影响[A]. 中国植物营养与肥料学会学术年会论文集[C]. 北京: 中国植物营养与肥料学会, 2012.
Gao W, Yang J, Ren S R, et al. Effects of long-term positioning of fertilizers on soil fertility and crop yield[A]. Proceedings of Annual Conference of the Chinese Society of Plant Nutrition and Fertilizer[C]. Beijing: Chinese Society of Plant Nutrition and Fertilizer, 2012. |
| [17] | Bai Z H, Li H G, Yang X Y, et al. The critical soil P levels for crop yield, soil fertility and environmental safety in different soil types[J]. Plant & Soil, 2013, 372(1/2): 27–37. |
| [18] |
史吉平, 张夫道, 林葆. 长期施用氮磷钾化肥和有机肥对土壤氮磷钾养分的影响[J].
中国土壤与肥料, 1998, (1): 7–10.
Shi J P, Zhang F D, Lin B. Effects of long-term application of N, P and K fertilizers and organic fertilizers on soil nitrogen, phosphorus and potassium nutrients[J]. Soil and Fertilizer Sciences in China, 1998, (1): 7–10. |
| [19] | Shen P, Xu M G, Zhang H M, et al. Long-term response of soil Olsen-P and organic C to the depletion or addition of chemical and organic fertilizers[J]. Catena, 2014, 118: 20–27. DOI:10.1016/j.catena.2014.01.020 |
| [20] |
信秀丽, 钦绳武, 张佳宝, 等. 长期不同施肥下潮土磷素的演变特征[J].
植物营养与肥料学报, 2015, 21(6): 1514–1520.
Xin X L, Qin S W, Zhang J B, et al. Evolution characteristics of phosphorus in fluvo-aquic soil under long-term different fertilization[J]. Journal of Plant Nutrition and Fertilizer, 2015, 21(6): 1514–1520. |
| [21] | Zhan X Y, Zhang L, Zhou B K, et al. Changes in Olsen phosphorus concentration and its response to phosphorus balance in black soils under different long-term fertilization patterns[J]. PLoS One, 2015, 10(7): 20–27. |
| [22] |
占丽平, 李小坤, 鲁剑巍, 等. 土壤钾素运移的影响因素研究进展[J].
土壤, 2012, 44(4): 548–553.
Zhan L P, Li X K, Lu J W, et al. Research progress on influencing factors of soil potassium transport[J]. Soils, 2012, 44(4): 548–553. DOI:10.3969/j.issn.0253-9829.2012.04.004 |
| [23] |
韩天富. 酸化红壤施石灰后根际土壤钾素转化特征与机制[D]. 北京: 中国农业科学院硕士学位论文, 2017.
Han T F. Characteristics and mechanism of potassium transformation in rhizosphere soil after acidification of red soil[D]. Beijing: MS Thesis of Chinese Academy of Agricultural Sciences, 2017. |
| [24] |
李继福, 鲁剑巍, 任涛, 等. 稻田不同供钾能力条件下秸秆还田替代钾肥效果[J].
中国农业科学, 2014, 47(2): 292–302.
Li J F, Lu J W, Ren T, et al. Effect of straw returning to replace potassium fertilizer under different potassium supply capacity in rice fields[J]. Scientia Agricultura Sinica, 2014, 47(2): 292–302. |
| [25] |
张瑜, 郭景恒. 华北平原潮土酸度特征与酸化敏感性的初步探讨[J].
环境化学, 2011, 30(6): 1126–1130.
Zhang Y, Guo J H. Preliminary study on acidity characteristics and acidification sensitivity of fluvo-aquic soil in North China Plain[J]. Environmental Chemistry, 2011, 30(6): 1126–1130. |
| [26] | Gong F F, Zha Y, Wu X P, et al. Analysis on basic soil productivity change of winter wheat in fluvo-aquic soil under long-term fertilization[J]. Transactions of the Chinese Society of Agricultural Engineering, 2013, 29(12): 120–129. |
| [27] | Guo J H, Liu X J, Zhang Y, Shen J L, et al. Significant acidification in major Chinese croplands[J]. Science, 2010, 327(5968): 1008–1010. DOI:10.1126/science.1182570 |
| [28] |
马俊永, 李科江, 曹彩云, 等. 有机−无机肥长期配施对潮土土壤肥力和作物产量的影响[J].
植物营养与肥料学报, 2007, 13(2): 236–241.
Ma J Y, Li K J, Cao C Y, et al. Effects of long-term combined application of organic and inorganic fertilizers on soil fertility and crop yield in fluvo-aquic soil[J]. Plant Nutrition and Fertilizer Science, 2007, 13(2): 236–241. DOI:10.3321/j.issn:1008-505X.2007.02.009 |
| [29] | Hejcman M, Kunzova E. Sustainability of winter wheat production on sandy-loamy Cambisol in the Czech Republic: Results from a long-term fertilizer and crop rotation experiment[J]. Field Rotation Experiment, 2010, 115: 191–199. |
| [30] |
杨梅花, 赵小敏, 王芳东, 等. 基于主成分分析的最小数据集的肥力指数构建[J].
江西农业大学学报, 2016, 38(6): 1188–1195.
Yang M H, Zhao X M, Wang F D, et al. Fertility index construction based on the smallest data set of principal component analysis[J]. Acta Agriculturae Universitatis Jiangciensis, 2016, 38(6): 1188–1195. |
| [31] | Pan C, Xiao B, Liu Y, et al. Comprehensive evaluation on the soil fertility in cultivation base of Pithecellobium clypearia in Conghua City of Guangdong Province[J]. Medicinal Plant, 2013, (6): 17–19, 23. |
 2018, Vol. 24
  doi:
doi: 

