2. 中国科学院大学,北京 100049
2. University of Chinese Academy of Sciences, Beijing 100049, China
土壤重金属含量与人类的健康息息相关[1–2],其污染状况及形成机理受到了广泛关注[3–4],了解土壤重金属污染状况及其污染物来源是土壤风险评价及其风险管理的基础,可为后续的治理和修复提供必要的依据[5–6]。目前研究土壤重金属来源的分析方法主要包括对元素进行化学形态研究、剖面分布、同位素示踪研究以及进行地统计学分析和多元统计分析等[7–10],近年来由于地统计学可以更加直观地了解土壤重金属的空间分布特征,从宏观尺度解析土壤重金属的污染成因,受到广泛应用[11]。
地统计学通过半变异函数的计算、拟合和比较等对土壤变量的空间结构进行定量描述,从而进一步探索和解析土壤重金属空间分布及其污染成因。例如,Zhou等利用地统计学方法对江苏省里下河区域的土壤重金属分析发现Cd和Zn主要受人类活动影响,变程分别为1.67和2.79 km;其余重金属元素主要受土壤母质等大尺度因素影响,变程在12.37~52.11 km之间[12];张乃明等对太原污灌区土壤重金属的研究表明,在该区域土壤重金属Pb和Hg具有强烈的空间相关性,主要受污灌、大气沉降以及化肥施用的影响,空间自相关距离分别为3.34和26.8 km,Cd元素具有中等程度的变异,受土壤母质、污灌等因素的共同影响,空间自相关距离为50.19 km[13]。在实际情况下,土壤重金属来源复杂,受自然因素和人为因素等诸多因素的影响[14–16]。在不同尺度因素作用下,在空间上表现出不同的结构特征。单一结构往往不足以表征其真实的空间结构特征,套合结构可更加全面地表征其空间特征[17]。例如,霍霄妮等[18]利用套合结构对北京市土壤重金属Cr、Ni、Zn和Hg进行研究发现重金属的空间变异性依赖于其空间尺度,多尺度套合模型能有效揭示土壤重金属空间分布特征。Rodríguez等[19]在3种不同尺度下对西班牙埃布罗河流域的土壤重金属进行了研究,结果表明基岩组分等因素在各个尺度上对土壤变异性均具有作用,人类活动只在中小尺度下对重金属的变异性存在明显影响,小尺度范围内Cd、Pb和Zn污染主要来自农业活动,Hg在中小尺度下的主要来源为大气沉降。
污水灌溉区土壤重金属污染严重、来源复杂,污水灌溉、成土母质、土地利用等因素均有可能影响其空间分布,现有研究对污灌区土壤重金属空间结构,尤其是多尺度因素影响下的空间结构研究不多。基于此,本研究以典型污灌区 (北京市东南郊) 土壤重金属Cu和Pb为例,讨论典型污灌区土壤重金属的空间结构特征以及不同尺度因素对其空间结构的影响,进一步解析土壤重金属的污染成因。
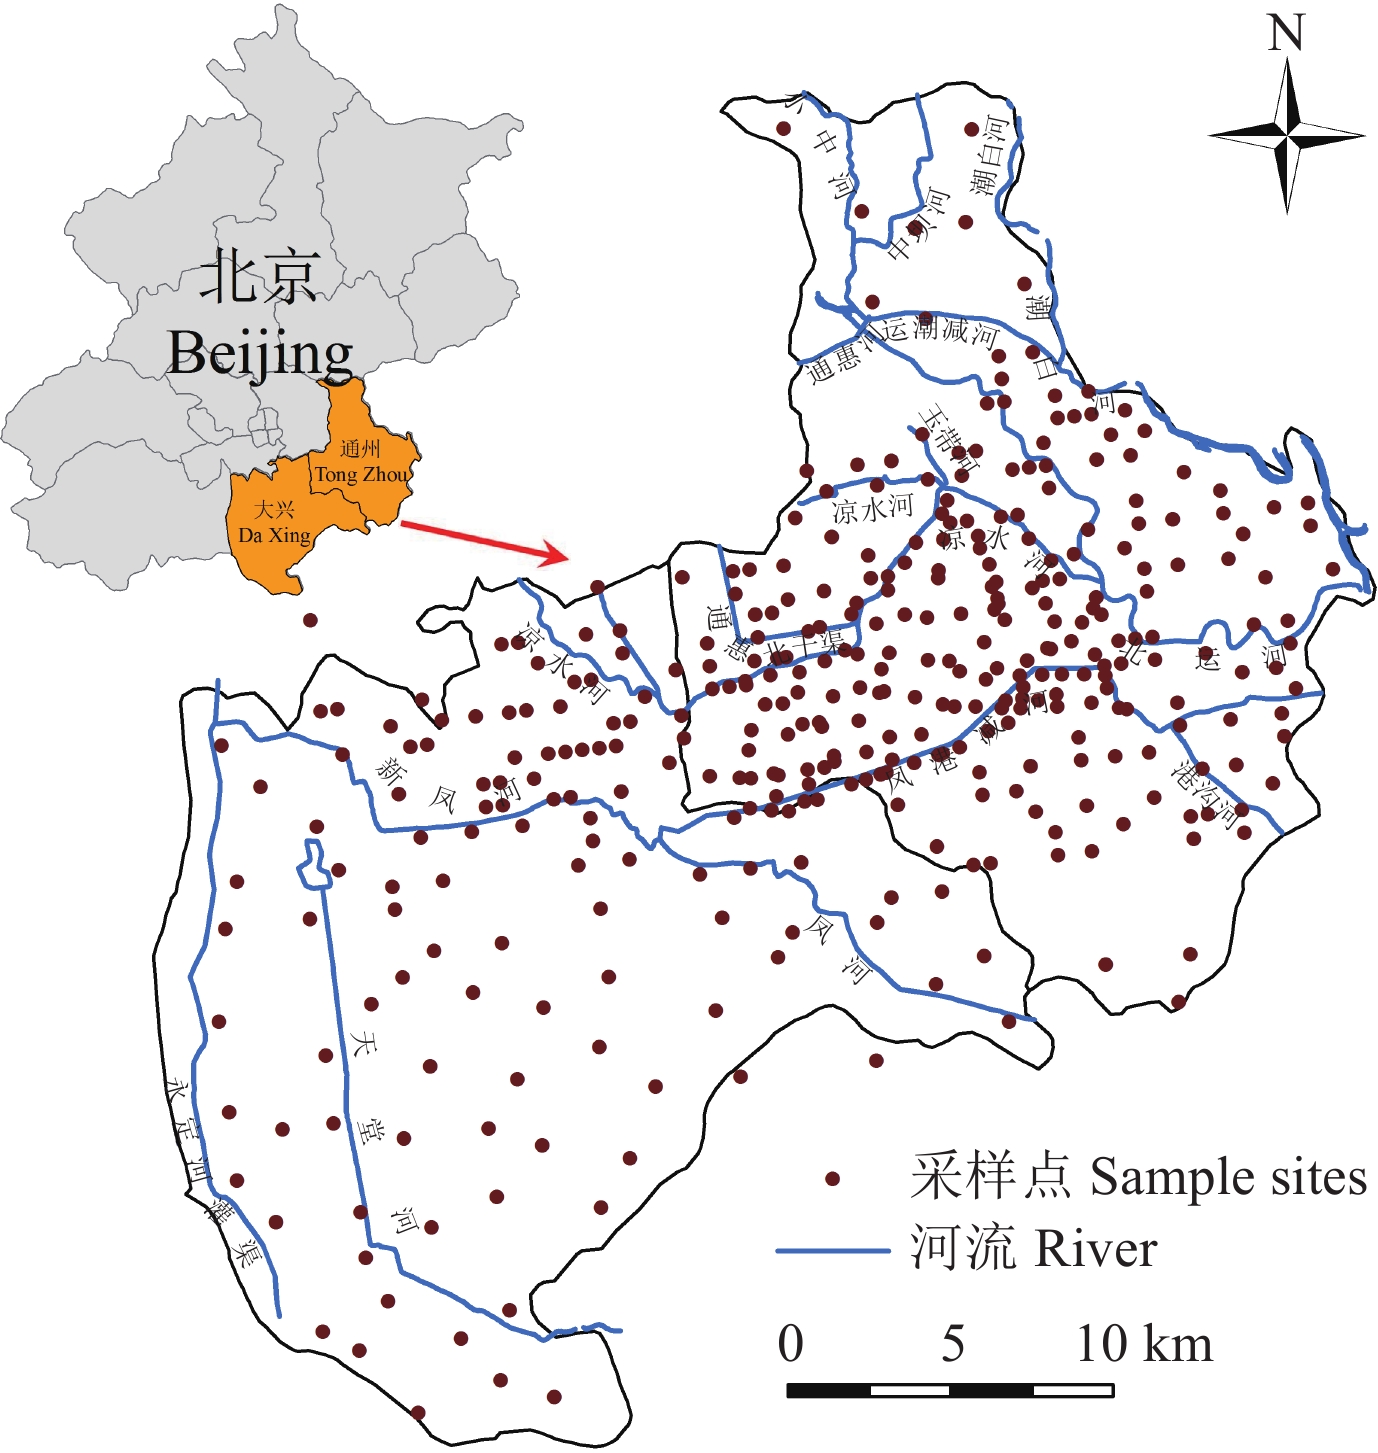
1 材料与方法 1.1 研究区域研究区域位于北京市东南的通州区和大兴区 (图1),属大陆性季风气候,年降雨量约620 mm。土壤类型为潮褐土、砂姜潮土,农作物类型以冬小麦、玉米为主。研究区域土壤pH值范围大致为7.8~8.6之间[20],属于中性偏碱性范围,土壤速效磷含量为7~30 mg/kg,速效钾含量为80~150 mg/kg。北京东南郊工业区的下游,处在由多条河流冲积作用形成的冲积扇平原上,地势平坦,土壤肥沃,适合农作物生长。由于北方地表水缺乏,不能满足农作物的生长需要。为保证农业生产,该区域早期主要引用凉水河以及凤港河河水进行灌溉。污灌时间可以追溯到上世纪六七十年代,区域污灌面积约为1.24 × 104 hm2,污灌时间为每年的3—6月和9—12月中旬,总计约为8个月。污水类型为混合污水,来源于城市生活污水和排污河道周边地区企业所排放的工业污水,污水灌溉量约为3 × 10³ m3/(hm2·a),灌溉水水质悬浮物高、有机物含量高、富含氮磷钾及重金属[21]。凉水河作为北京市主要纳污河,长期利用凉水河河水进行农田灌溉可能会使该区域的农田出现土壤重金属污染[22–23]。
 |
| 图1 研究区域土壤采样点分布图 Fig. 1 Spatial distribution of sampling sites in the studied area |
研究区范围覆盖通州和大兴两个区域,总面积为1932 km2。在整个区域首先进行均匀布点,样点密度1 km × 1 km;在均匀布点的基础上,对污灌区加密采样,采样密度1 km × 1 km。每个样点均采自10 m × 10 m正方形四个顶点和中心点,各取表层土壤约1 kg,均匀混合后用四分法从中选取1 kg土壤,作为代表该点的混合样品,采样过程中用GPS进行定位,共采集表层 (0—20 cm) 土壤样品376个。
土样在室内风干,过100目尼龙网筛,用美国国家环境保护局 (USEPA)3050B方法消煮[24]。分析过程中全部使用优级纯或光谱纯化学试剂和超纯水,Cu、Pb元素含量采用原子吸收火焰法进行测定[25]。分析过程中加入国家标准样品进行分析质量控制,各重金属回收率均在国家标准参比物质的容许范围内。排除在运输和分析测试过程中样品编号丢失的样品,经化学测定共获取Cu和Pb有效数据个数分别为364和375个。
1.3 数据分析土壤重金属数据的正态性分布检验利用SPSS20.0软件完成。用K-S(Kolmogorov-Smirnov) 方法,采取95%的置信区间检验土壤重金属数据是否符合正态分布。
土壤重金属半变异函数用Variowin2.0软件完成。根据数据拟合情况,土壤Cu和Pb的全方向实验半变异函数以及不同方向实验半变异函数均采用球状模型拟合。
球状模型公式如下:
| $\gamma^* (h) = \frac{1}{{2N(h)}}{\sum\limits_{i = 1}^{N(h)} {\left[ {Z({x_i}) - Z({x_i} + h)} \right]} ^2}$ | (1) |
| $\gamma^* (h) = \left\{ {\begin{aligned}& 0\;\;\;\;\;\quad\quad\quad\quad\quad\quad\quad\quad\quad{h = 0}\\& {{C_0} + C(\frac{3}{2} \cdot \frac{h}{a} - \frac{1}{2} \cdot \frac{{{h^3}}}{{{a^3}}})}\;\;\;{0 {<} h {≤} a}\\& {{C_0} + C}\;\;\;\quad\quad\quad\quad\quad\quad\quad{h {>} a}\end{aligned}} \right.$ | (2) |
式 (1) 中N(h) 表示研究区内间隔为h的点对数,Z(xi) 和Z(xi+h) 分别为点在xi和xi +h处的测量值,h为两个分隔样点的距离。式 (2) 中C0表示实验误差以及在最小采样尺度下的空间变异,即块金常数;C为拱高。随着步长的增加,半变异函数逐渐增加,当变异函数值达到某一平台时的样本间距称为相关距离a。相关距离表明当样本间的距离等于或大于该距离时,样本之间就不存在任何相关性。变差距离所达到的平台值叫做变异函数的基台值 (C0+C)。通常利用块金值与基台值的比值来表征元素的空间自相关性的强弱,当其比值小于25%表明其具有极强的空间自相关性,其空间结构主要受结构性因素影响;当比值在25%~75%之间时,表明其具有较强的空间自相关性,其空间结构一般受自然因素与人为因素的共同影响;当比值大于75%时表明其空间自相关性较弱,其空间结构主要受随机性因素影响[26, 27]。
研究区域土壤重金属空间预测采用ArcGIS10.2软件完成。采用普通克里格对重金属含量进行空间插值。克里格插值是利用原始数据以及半变异函数模型的特征参数对未采样点的区域化变量进行无偏最优的一种插值方法,其优点在于最大限度地利用了空间取样所提供的各种信息[28]。
2 结果与分析 2.1 研究区域土壤重金属含量特征经Kolmogorov-Smirnov检验得出,原始数据中Pb元素符合正态分布 (图2),Cu元素不符合正态分布,将Cu元素数据对数转换后数据符合正态分布 (图2)。图2显示研究区域土壤重金属含量数据及其对数转换后的频数分布情况。
 |
| 图2 土壤Pb、Cu含量频数和Cu含量对数分布图 Fig. 2 Normal school diagram of soil Pb, Cu contents and logarithm of Cu content |
研究区域Cu和Pb均有不同程度的累积。如表1所示,土壤Cu和Pb含量均高于北京市Cu(19.7 mg/kg) 和Pb(25.10 mg/kg) 土壤背景值[29](P < 0.05)。与北京市土壤重金属基线值相比,研究区域分别有38个Cu样品以及72个Pb样品超过基线值,分别占样品总量的10.4%和19.2%。
| 表1 研究区域土壤Cu、Pb含量和北京市土壤背景值 (mg/kg) Table 1 Soil Cu and Pb concentrations in the studied area and the background values in Beijing |
 |
研究区域土壤Cu、Pb的空间结构均表现为2层结构的套合结构 (表2、图3),块金效应均在25%~75%之间,呈现中等程度相关,说明研究区域重金属元素受自然因素和人为因素的共同影响。在步长h为0时,2种重金属元素均具有明显的块金效应,Cu和Pb的块金值分别为1.29 × 10⁻²和27.62。在结构1下,随着步长的增加,2种重金属的基台值也随之增加,当步长h增加到一定程度时,2种重金属的基台值逐渐达到相对稳定,数值分别为2.07 × 10⁻²和45.01,此时重金属元素的变程分别为11.35和9.49 km。在结构2下,随着步长持续增加,元素基台值继续增大,空间自相关性进一步增强,直到2种重金属元素的基台值再一次达到稳定,此时重金属元素对应的基台值3.00 × 10⁻²和53.94,变程分别为26.65和31.70 km。
| 表2 研究区域土壤Cu、Pb半变异函数模型 Table 2 Semivariogram models of soil Cu and Pb in the study area |
 |
 |
| 图3 研究区域土壤Cu、Pb变异函数图 Fig. 3 Variograms of soil Cu and Pb in the studied area [注(Note):结构1、2分别表征研究区域土壤重金属空间变异函数图,结构1表示由小尺度因素主导的半变异函数,结构2表示由大尺度因素主导的半变异函数Structure 1 and structure 2 describe the spatial variogram of soil heavy metals in the studied area, respectively. Structure 1 represents the semivariogram dominated by small-scale factors, and structure 2 represents the semivariogram dominated by large-scale factors.] |
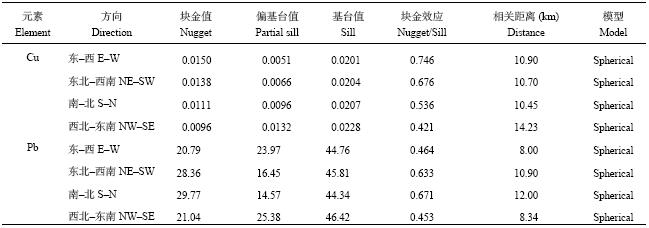
研究区域土壤重金属含量在不同方向上空间自相关性存在明显的差异 (表3)。Cu和Pb在西北–东南方向空间连续性最强,其块金值与基台值的比值分别为0.421和0.453,空间自相关距离分别为14.23和8.34 km。Cu在东–西方向空间连续性较差,其块金值与基台值的比值为0.746,空间自相关距离为10.90 km。Pb在南–北方向空间连续性较差,其块金值与基台值的比值为0.671,空间自相关距离为12.00 km。
| 表3 研究区域Cu、Pb不同方向半变异函数的拟合参数统计 Table 3 Parameters of semivariograms of Cu and Pb in different directions of the study area |
 |
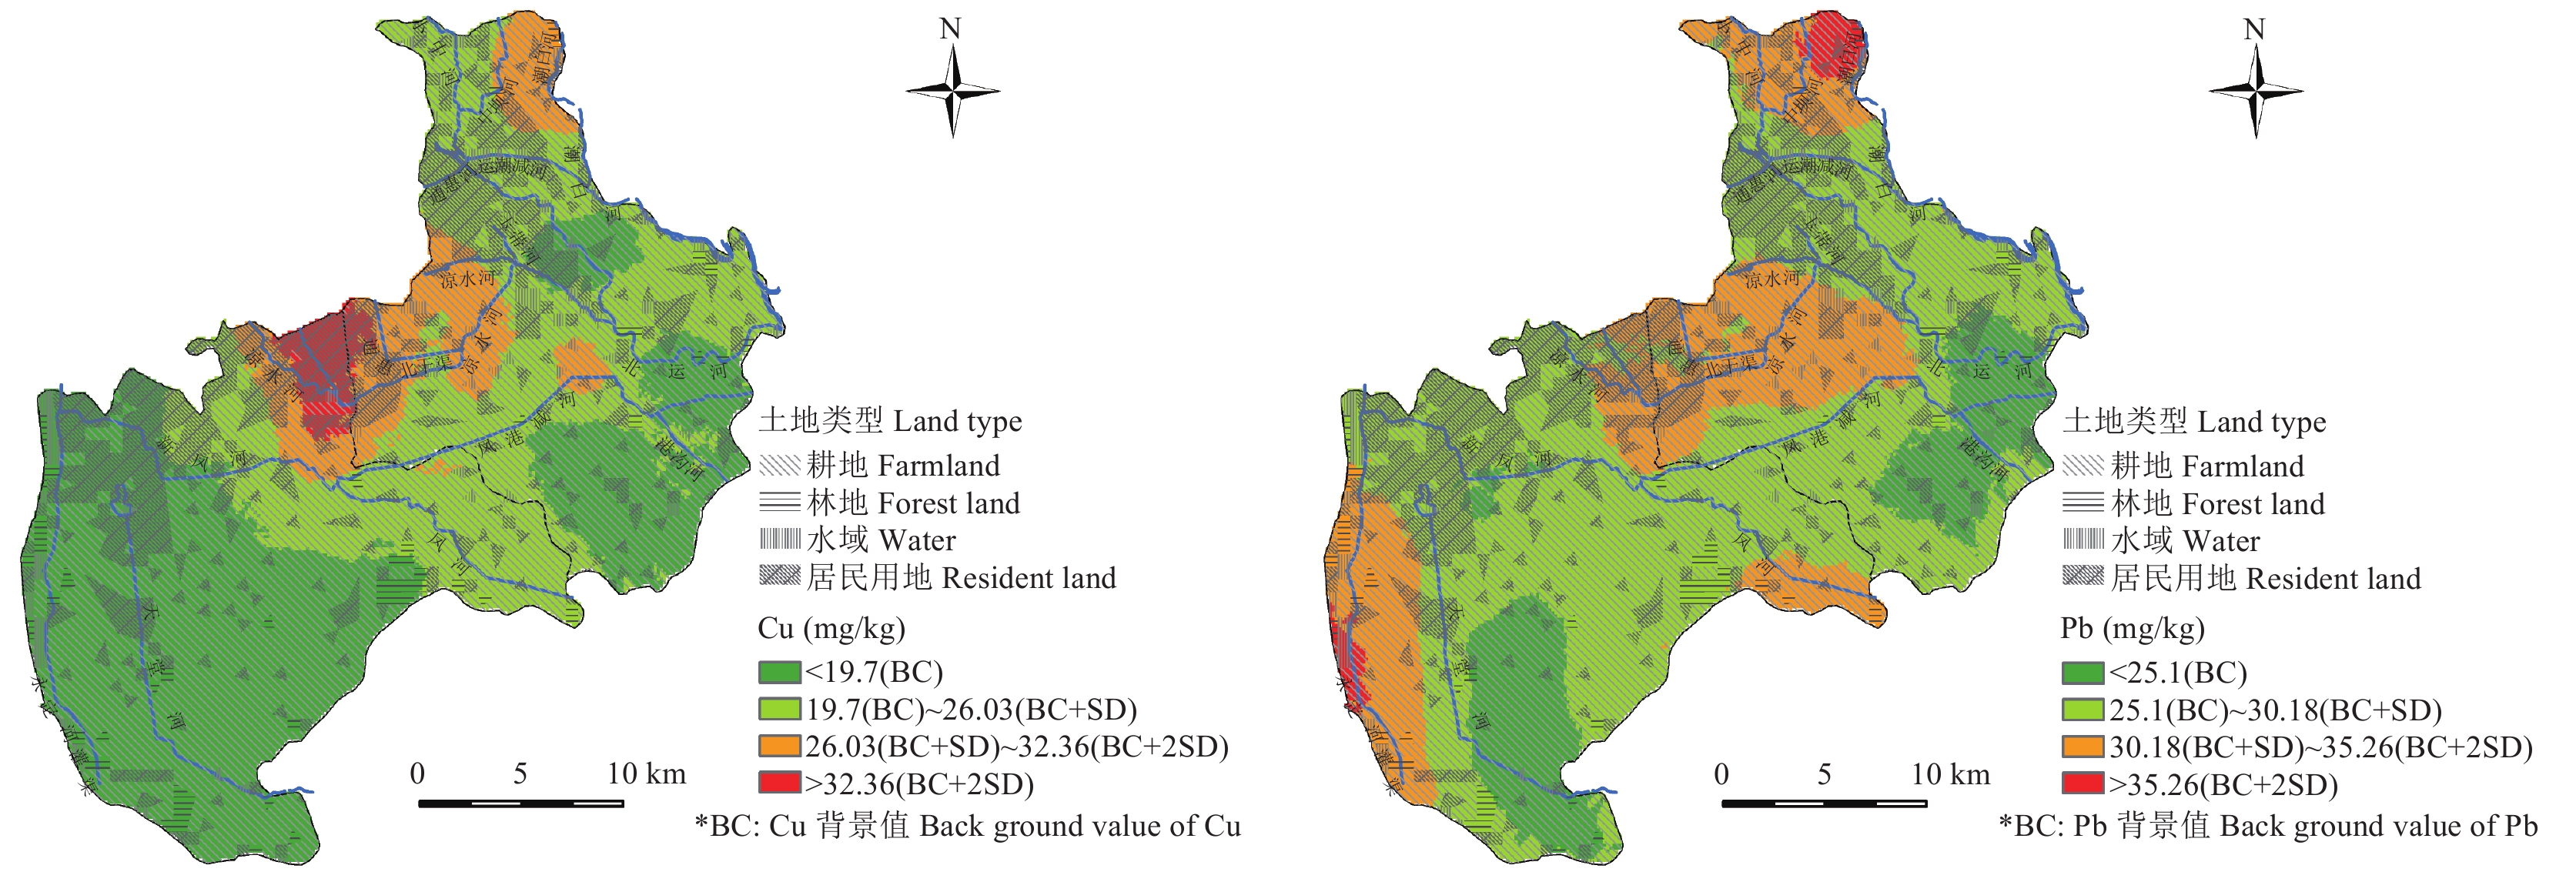
研究区域土壤重金属空间分布差异较大,部分地区重金属累积现象明显。对于Cu元素,研究区域的中北部以及通州区北部含量较高,均在26.03 mg/kg以上,在中北部部分地区含量甚至大于32.36 mg/kg,远远超过北京市土壤Cu含量背景值 (19.7 mg/kg);Pb高值区域主要分布在河流附近,分别位于通州西部凉水河流域以及大兴区西部永定河流域,另有一部分高值区域位于通州北部,含量在30.18 mg/kg以上,部分地区含量高于极限值35.26 mg/kg (图4)。
 |
| 图4 研究区域土壤Cu、Pb含量空间分布 Fig. 4 Spatial distribution of soil Cu and Pb concentrations in the study area |
污水灌溉与成土母质是研究区域土壤重金属的主要来源。Cu和Pb元素在凉水河流域处于高值区域与该区域长期进行污水灌溉有关。凉水河曾经是北京市纳污河,接纳北京市城市污水,污水及河流底泥中重金属含量较高。调查研究表明凉水河底泥中受Pb和Cr元素污染尤其严重,两元素平均含量分别为185.08和272.05 mg/kg[21]。如胡文等[30]对凉水河污灌区的研究发现凉水河区域土壤Cu、Zn、Cr和Pb含量都显著高于北京市土壤环境背景值,其中Cu和Pb的均值分别达到背景值的3.5倍和4.5倍;杨军等[31]对北京市凉凤灌区土壤重金属进行分析,表明灌区内Cu和Pb超标率分别为8.33%和8.86%,与20世纪70年代中期调查结果比较发现,该区域Cu和Pb元素含量分别增加了26%和40%。研究区域凤港河是一条人工河,主要作用是防洪除涝,河水主要来源是地表径流[20]。沿河两岸的农田均有地表水 (河水) 灌溉的历史,河流功能的不同导致河水重金属含量各异,河水的差异导致Cu和Pb在土壤中的累积程度各异,形成了由西北向东南浓度梯度递减的趋势。此外,由重金属空间分布图可以看出研究区域大部分地区土壤重金属含量与北京市土壤背景值含量接近,表明自然成土母质是该区域土壤重金属的主要来源。
工业废弃物排放以及土地利用类型等也是影响区域土壤重金属含量的主要因素。大兴区西部永定河流域的Pb含量高值区可能与永定河上游石景山地区的钢铁工业企业排放废气颗粒物沉降等密切相关[20],如韩鹏等对首钢区域土壤重金属研究发现该区域Pb元素平均含量为31.1 mg/kg,高于北京市Pb土壤背景值 (25.1 mg/kg),呈现一定程度的累积[32]。研究区域土地利用类型也是导致区域土壤重金属含量产生差异的原因之一,研究表明土壤重金属元素含量与郊区土地集约利用程度密切相关,不同土地利用类型农业生产强度不同,农业投入品施用量差异很大,从而导致区域土壤重金属含量存在差异[33–34]。
3.2 土壤重金属空间结构与污染成因分析本研究中Cu和Pb元素均由2种空间结构构成,是2种尺度因素共同作用的综合体现。Journel等[35]认为,具有复杂变化的区域性变量的空间结构特征,不能用一个简单的理论模型去描述,需要用2个以上理论模型去描述,其空间变异性是由很多不同尺度的原因所引起的,所有这些原因或结构同时起作用并体现在空间自相关距离上。Clark[36]研究也表明在不同尺度范围下利用单一的函数对半变异函数进行拟合并不理想,不同尺度范围对应的半变异函数并不相同,需要在不同的尺度范围利用不同的半变异函数对区域性变量的空间结构进行描述和表征。本研究中,土壤Cu和Pb高值区与污灌河流分布大体一致,研究区域凉水河大致走向是由西至东,污水灌溉导致凉水河两岸土壤Cu和Pb含量升高,离河越近,灌溉的概率越大,污染越严重。因此在空间结构上,Cu和Pb在西北–东南方向空间相关性较强,由污水灌溉因素主导的空间自相关距离分别为11.35 km和9.49 km;研究区域Cu和Pb含量小于或等于北京市土壤背景值的面积分别占研究区域总面积的48.15%和15.03%,这部分由土壤母质等大尺度因素主导的空间自相关距离分别为26.65 km和31.70 km。
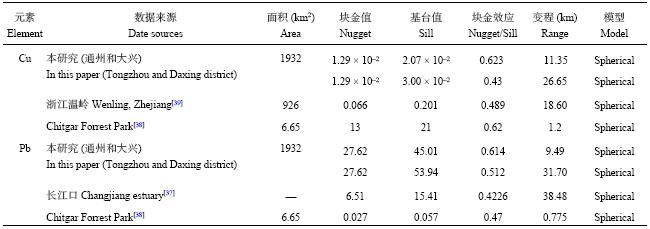
现有研究也显示不同尺度影响因素对土壤重金属空间结构有明显的影响 (表4)。Wang等[37]对长江河口重金属Pb进行了研究,Pb元素的变程为38.48 km,体现出大尺度因素如土壤母质、风力与地形等因素影响;Mahmoudabadi等[38]对德黑兰市西部工业区土壤重金属空间结构研究发现Cu和Pb等元素变程分别为1.2 km和0.775 km,体现出人类活动等小尺度因素的影响。
| 表4 不同研究尺度下土壤重金属半变异函数拟合模型参数 Table 4 Semivariogram models of soil heavy metals and their parameters under different scales |
 |
1) 研究区域土壤Cu、Pb呈现不同程度的累积现象,且空间分布不均匀。Cu和Pb分别有38个和72个样品超过基线值,其高值区主要分布在研究区域中北部的凉水河流域、西部的永定河流域以及通州东北部。
2) Cu、Pb的空间分布与河流走向密切相关,在西北–东南方向空间相关性较强。污水灌溉导致河流两岸土壤Cu和Pb含量升高,离河越近,污染越严重。
3) 研究区域土壤Cu和Pb主要来源于污水灌溉和成土母质,在空间上均呈现2种尺度因素并存的套合结构,由污水灌溉主导的空间相关距离分别为11.35 km和9.49 km,由土壤母质等大尺度因素主导的空间自相关距离分别为26.65 km和 31.70 km。
| [1] | Ihedioha J N, Ukoha P O, Ekere N R. Ecological and human health risk assessment of heavy metal contamination in soil of a municipal solid waste dump in Uyo, Nigeria[J]. Environmental Geochemistry and Health, 2017, 39(3): 497–515. DOI:10.1007/s10653-016-9830-4 |
| [2] |
徐友宁, 张江华, 柯海玲, 等. 某金矿区农田土壤重金属污染的人体健康风险[J].
地质通报, 2014, 33(8): 1239–1252.
Xu Y N, Zhang J H, Ke H L, et al. Human health risk under the condition of farmland soil heavy metals pollution in a gold mining area[J]. Geological Bulletin of China, 2014, 33(8): 1239–1252. |
| [3] |
黄绍文, 唐继伟, 李春花. 不同栽培方式菜田耕层土壤重金属状况[J].
植物营养与肥料学报, 2016, 22(3): 707–718.
Huang S W, Tang J W, Li C H. Status of heavy metals in vegetable soils under different patterns of land use[J]. Journal of Plant Nutrition and Fertilizer, 2016, 22(3): 707–718. DOI:10.11674/zwyf.14590 |
| [4] |
祖艳群, 卢鑫, 湛方栋, 等. 丛枝菌根真菌在土壤重金属污染植物修复中的作用及机理研究进展[J].
植物生理学报, 2015, 51(10): 1538–1548.
Zu Y Q, Lu X, Zhan F D, et al. A review on roles and mechanisms of arbuscular mycorrhizal fungi in phytoremediation of heavy metals-polluted soils[J]. Plant Physiology Journal, 2015, 51(10): 1538–1548. |
| [5] | Borůvka L, Vacek O, Jehlička J. Principal component analysis as a tool to indicate the origin of potentially toxic elements in soils[J]. Geoderma, 2005, 128(3-4): 289–300. DOI:10.1016/j.geoderma.2005.04.010 |
| [6] |
张长波, 李志博, 姚春霞, 等. 污染场地土壤重金属含量的空间变异特征及其污染源识别指示意义[J].
土壤, 2006, 38(5): 525–533.
Zhang C B, Li Z B, Yao C X, et al. Characteristics of spatial variability of soil heavy metal contents in contaminated sites and their implications for source identification[J]. Soils, 2006, 38(5): 525–533. |
| [7] | Zhang J, Wang Y, Liu J, et al. Multivariate and geostatistical analyses of the sources and spatial distribution of heavy metals in agricultural soil in Gongzhuling, Northeast China[J]. Journal of Soils and Sediments, 2016, 16(2): 634–644. DOI:10.1007/s11368-015-1225-0 |
| [8] | Kaasalainen M, Yli-Halla M. Use of sequential extraction to assess metal partitioning in soils[J]. Environmental Pollution, 2003, 126(2): 225–233. DOI:10.1016/S0269-7491(03)00191-X |
| [9] | Blaser P, Zimmermann S, Luster J, Shotyk W. Critical examination of trace element enrichments and depletions in soils: As, Cr, Cu, Ni, Pb, and Zn in Swiss forest soils[J]. Science of the Total Environment, 2000, 249(1-3): 257–280. DOI:10.1016/S0048-9697(99)00522-7 |
| [10] | Gao B, Zhou H, Liang X, Tu X. Cd isotopes as a potential source tracer of metal pollution in river sediments[J]. Environmental Pollution, 2013, 181(6): 340–343. |
| [11] | Lü J, Liu Y, Zhang Z, et al. Identifying the origins and spatial distributions of heavy metals in soils of Ju country (Eastern China) using multivariate and geostatistical approach[J]. Journal of Soils and Sediments, 2015, 15(1): 163–178. DOI:10.1007/s11368-014-0937-x |
| [12] | Zhou J, Feng K, Pei Z, Lu M. Pollution assessment and spatial variation of soil heavy metals in Lixia River Region of Eastern China[J]. Journal of Soils and Sediments, 2016, 16(3): 748–755. DOI:10.1007/s11368-015-1289-x |
| [13] |
张乃明, 李保国. 太原污灌区土壤重金属和盐分含量的空间变异特征[J].
环境科学学报, 2001, 21(3): 349–353.
Zhang N M, Li B G. Spatial variabilities of heavy metals and salt contents in soils of Taiyuan sewage irrigation region[J]. Acta Scientiae Circumstantiae, 2001, 21(3): 349–353. |
| [14] | Stafilov T, Šajn R, Boev B. Distribution of some elements in surface soil over the Kavadarci region, Republic of Macedonia[J]. Environmental Earth Sciences, 2010, 61(7): 1515–1530. DOI:10.1007/s12665-010-0467-9 |
| [15] | Atafar Z, Mesdaghinia A, Nouri J, et al. Effect of fertilizer application on soil heavy metal concentration[J]. Environmental Monitoring & Assessment, 2010, 160(1-4): 83–89. |
| [16] | Lough G C, Schauer J J, Park J S, et al. Emissions of metals associated with motor vehicle roadways[J]. Environmental Science & Technology, 2005, 39(3): 826–836. |
| [17] | Sinclair A J, Werner L J. Geostatistical investigation of the Kutcho Creek chrysotile deposit, Northern British Columbia[J]. Mathematical Geosciences, 1978, 10(3): 273–288. |
| [18] |
霍霄妮, 李红, 张微微, 等. 北京耕作土壤重金属多尺度空间结构[J].
农业工程学报, 2009, 25(3): 223–229.
Huo X N, Li H, Zhang W W, et al. Multi-scale spatial structure of heavy metals in Beijing cultivated soils[J]. Transactions of the Chinese Society of Agricultural Engineering, 2009, 25(3): 223–229. |
| [19] | Rodríguez J A, Nanos N, Grau J M, et al. Multiscale analysis of heavy metal contents in Spanish agricultural topsoils[J]. Chemosphere, 2008, 70(6): 1085–1096. DOI:10.1016/j.chemosphere.2007.07.056 |
| [20] | Yang J, Huang Z C, Chen T B, et al. Predicting the probability distribution of Pb-increased lands in sewage-irrigated region: A case study in Beijing, China[J]. Geoderma, 2008, 147(3): 192–196. |
| [21] |
北京市东南郊环境污染调查及其防治途径研究协作组. 北京东南郊环境污染调查及其防治途径研究[R]. 1980.
Research Collaboration on Control Approaches and Environmental Pollution Investigation in Southeast Surburb of Beijing. Environmental pollution investigation and study of control approaches in the southeast surburb of Beijing[R]. 1980. |
| [22] |
金爱芳, 何江涛, 陈素暖, 魏永霞. 北京东南郊污灌区土壤有机氯农药的垂向分布特征[J].
环境科学学报, 2009, 29(9): 1970–1977.
Jin A F, He J T, Chen S N, Wei Y X. Distribution of organochlorine pesticides in soil profiles from wastewater irrigated areas in the southeast suburbs of Beijing[J]. Acta Scientiae Circumstantiae, 2009, 29(9): 1970–1977. |
| [23] | Liu W H, Zhao J Z, Ouyang Z Y, et al. Impacts of sewage irrigation on heavy metal distribution and contamination in Beijing, China[J]. Environment International, 2005, 31(6): 805–812. DOI:10.1016/j.envint.2005.05.042 |
| [24] | United States Environmental Protection Agency. Method 3050B: Acid digestion of sediments, sludges and soils (Revision 2) [S]. USEPA, 1996. |
| [25] | Zheng Y M, Chen T B, He J Z. Multivariate geostatistical analysis of heavy metals in topsoils from Beijing, China[J]. Journal of Soils and Sediments, 2008, 8(1): 51–58. DOI:10.1065/jss2007.08.245 |
| [26] | Chang Y H, Scrimshaw M D, Emmerson R H C, Lester J N. Geostatistical analysis of sampling uncertainty at the Tollesbury Managed Retreat site in Blackwater Estuary, Essex, UK: Kriging and cokriging approach to minimise sampling density[J]. Science of the Total Environment, 1998, 221(1): 43–57. DOI:10.1016/S0048-9697(98)00262-9 |
| [27] | Fu W, Zhao K, Zhang C, et al. Outlier identification of soil phosphorus and its implication for spatial structure modeling[J]. Precision Agriculture, 2016, 17(2): 121–135. DOI:10.1007/s11119-015-9411-z |
| [28] |
王政权. 地统计学及在生态学中的应用[M]. 北京: 科学出版社, 1999.
Wang Z Q. Geostatistics and its application in ecology [M]. Beijing: Science Press, 1999. |
| [29] |
陈同斌, 郑袁明, 陈煌, 郑国砥. 北京市土壤重金属含量背景值的系统研究[J].
环境科学, 2004, 25(1): 117–122.
Chen T B, Zheng Y M, Chen H, Zheng G D. Background concentrations of soil heavy metals in Beijing[J]. Environmental Science, 2004, 25(1): 117–122. |
| [30] |
胡文, 王海燕, 查同刚, 等. 北京市凉水河污灌区土壤重金属累积和形态分析[J].
生态环境学报, 2008, 17(4): 1491–1497.
Hu W, Wang H Y, Zha T G, et al. Soil heavy metal accumulation and speciation in a sewage‒irrigated area along the Liangshui River, Beijing[J]. Ecology and Environmental Sciences, 2008, 17(4): 1491–1497. |
| [31] |
杨军, 郑袁明, 陈同斌, 等. 北京市凉凤灌区土壤重金属的积累及其变化趋势[J].
环境科学学报, 2005, 25(9): 1175–1181.
Yang J, Zheng Y M, Chen T B, et al. Accumulation and temporal variation of heavy metals in the soils from the Liangfeng Irrigated Area, Beijing City[J]. Acta Scientiae Circumstantiae, 2005, 25(9): 1175–1181. |
| [32] |
韩鹏, 孙天河, 袁国礼, 黄勇. 首钢地区表层土壤重金属的分布特征及污染评价[J].
现代地质, 2012, 26(5): 963–971.
Han P, Sun T H, Yuan G L, Huang Y. Distribution and assessment of heavy metals in topsoil of Capital Steel Factory in Beijing, China[J]. Geoscience, 2012, 26(5): 963–971. |
| [33] | Kuusisto-Hjort P, Hjort J. Land use impacts on trace metal concentrations of suburban stream sediments in the Helsinki region, Finland[J]. Science of the Total Environment, 2013, 456–457: 222–230. |
| [34] | Wu L, Pan X, Chen L, et al. Occurrence and distribution of heavy metals and tetracyclines in agricultural soils after typical land use change in east China[J]. Environmental Science and Pollution Research, 2013, 20(12): 8342–8354. DOI:10.1007/s11356-013-1532-1 |
| [35] | Journel A G, Huijbregts C. Mining geostatistics [M]. New York: Academic Press, 1978. |
| [36] | Clark I. Practical geostatistics [M]. London: Applied Science, 1979. |
| [37] | Wang J, Liu R, Zhang P, et al. Spatial variation, environmental assessment and source identification of heavy metals in sediments of the Yangtze River Estuary[J]. Marine Pollution Bulletin, 2014, 87(1-2): 364–373. DOI:10.1016/j.marpolbul.2014.07.048 |
| [38] | Mahmoudabadi E, Sarmadian F, Moghaddam R N. Spatial distribution of soil heavy metals in different land uses of an industrial area of Tehran (Iran)[J]. International Journal of Environmental Science and Technology, 2015, 12(10): 3283–3298. DOI:10.1007/s13762-015-0808-z |
| [39] | Zhao K, Fu W, Liu X, et al. Spatial variations of concentrations of copper and its speciation in the soil-rice system in Wenling of southeastern China[J]. Environmental Science and Pollution Research, 2014, 21(11): 7165–7176. DOI:10.1007/s11356-014-2638-9 |
 2018, Vol. 24
  doi:
doi: 

