土壤 pH 是土壤最重要的指标之一,其深刻地影响着土壤养分的有效性,也影响有害元素的活性,是大多数作物生长的一个主要环境因子[1],因此它是土壤化学中最为综合和重要的特征,也是耕地质量评价体系中的重要因子[2–5]。目前,土壤酸化已成为全社会关注的热点,土壤酸化在我国南方已相当严重[6–11]。据相关资料显示,连续施用化学氮肥 10~20 年,部分耕层土壤 pH 下降幅度可超过 1 个单位,且随施氮量的增加而明显增加[12–20]。郭治兴等[7]研究显示广东省在 20 年多年时间内土壤整体表现为酸化,但空间分布格局基本不变。曾招兵等[8]利用广东省的长期定位试验监测数据,发现 1984 年以来水稻土整体呈明显的酸化趋势,水稻土 pH 下降了 0.33 单位,强酸和酸性土壤的分布频率呈明显的上升趋势。王志刚等[6]通过比较 1980 年和 2003 年江苏省土壤 pH 空间分布图,发现南酸北碱,但局部地区存在较大的变化,总体表现为酸化。邵学新等[9]通过调查和分析江苏省张家港市 2004 年和 1980 年的土壤 pH,发现自第二次土壤普查以来土壤 pH 明显下降。扬州市是国家重要的商品粮基地,耕地土壤酸化对粮食安全生产至关重要。30 年来种植制度、耕作制度、施肥、降雨等的变化,对耕地土壤酸化产生了什么影响?为此对扬州市耕地土壤 30 年 pH 值演变及驱动因子做了系统研究,旨在为预测和控制土壤酸化提供科学依据。
1 材料与方法 1.1 研究区域概况扬州市位于东经 119°01′ 至 119°54′、北纬 31°56′ 至 33°25′,地处江苏中部,南邻长江,北接淮安,东和盐城、泰州毗连,西与南京市、淮安市和安徽省天长市接壤。境内有长江岸线 80.5 km,沿江有仪征、邗江、江都三县 (市、区);京杭大运河纵穿腹地,境内全长 143.3 km,由北向南沟通白马湖、宝应湖、高邮湖、邵伯湖,汇入长江。属于亚热带湿润气候区,四季分明,东、西分别受海洋性气候和内陆性气候的交替影响,季风显著,盛行风向随季节有明显的变化,冬夏冷热悬殊较大;无霜期 220 多天;雨量充沛,雨热同季,光热水资源较好。可满足小麦、棉花、水稻、各种蔬菜生长,对农业发展极为有利,是国家重要商品粮基地。
扬州市境内地貌类型以平原为主,地势西高东低,地貌类型 (图 1 左) 分为里下河洼地、通南高沙土 (沿江高沙土)、沿江圩区 (滨江圩区) 和丘陵 (低丘缓岗) 四个农业区。成土母质 (图 1 中) 分为湖相沉积物、黄泛冲积物、黄淮冲积物、黄土母质、基岩残积物、下蜀黄土、长江冲积物、长江淤积物。土壤类型分为水稻土、潮土、黄棕壤、沼泽土 4 个土类;根据主导形成过程不同的发育阶段或次要的形成过程细分成 11 个亚类(图 1 右);依据成土母质类型、水文地势条件分成 27 个土属;依据一米深度的土体层次排列细分为 101 个土种。
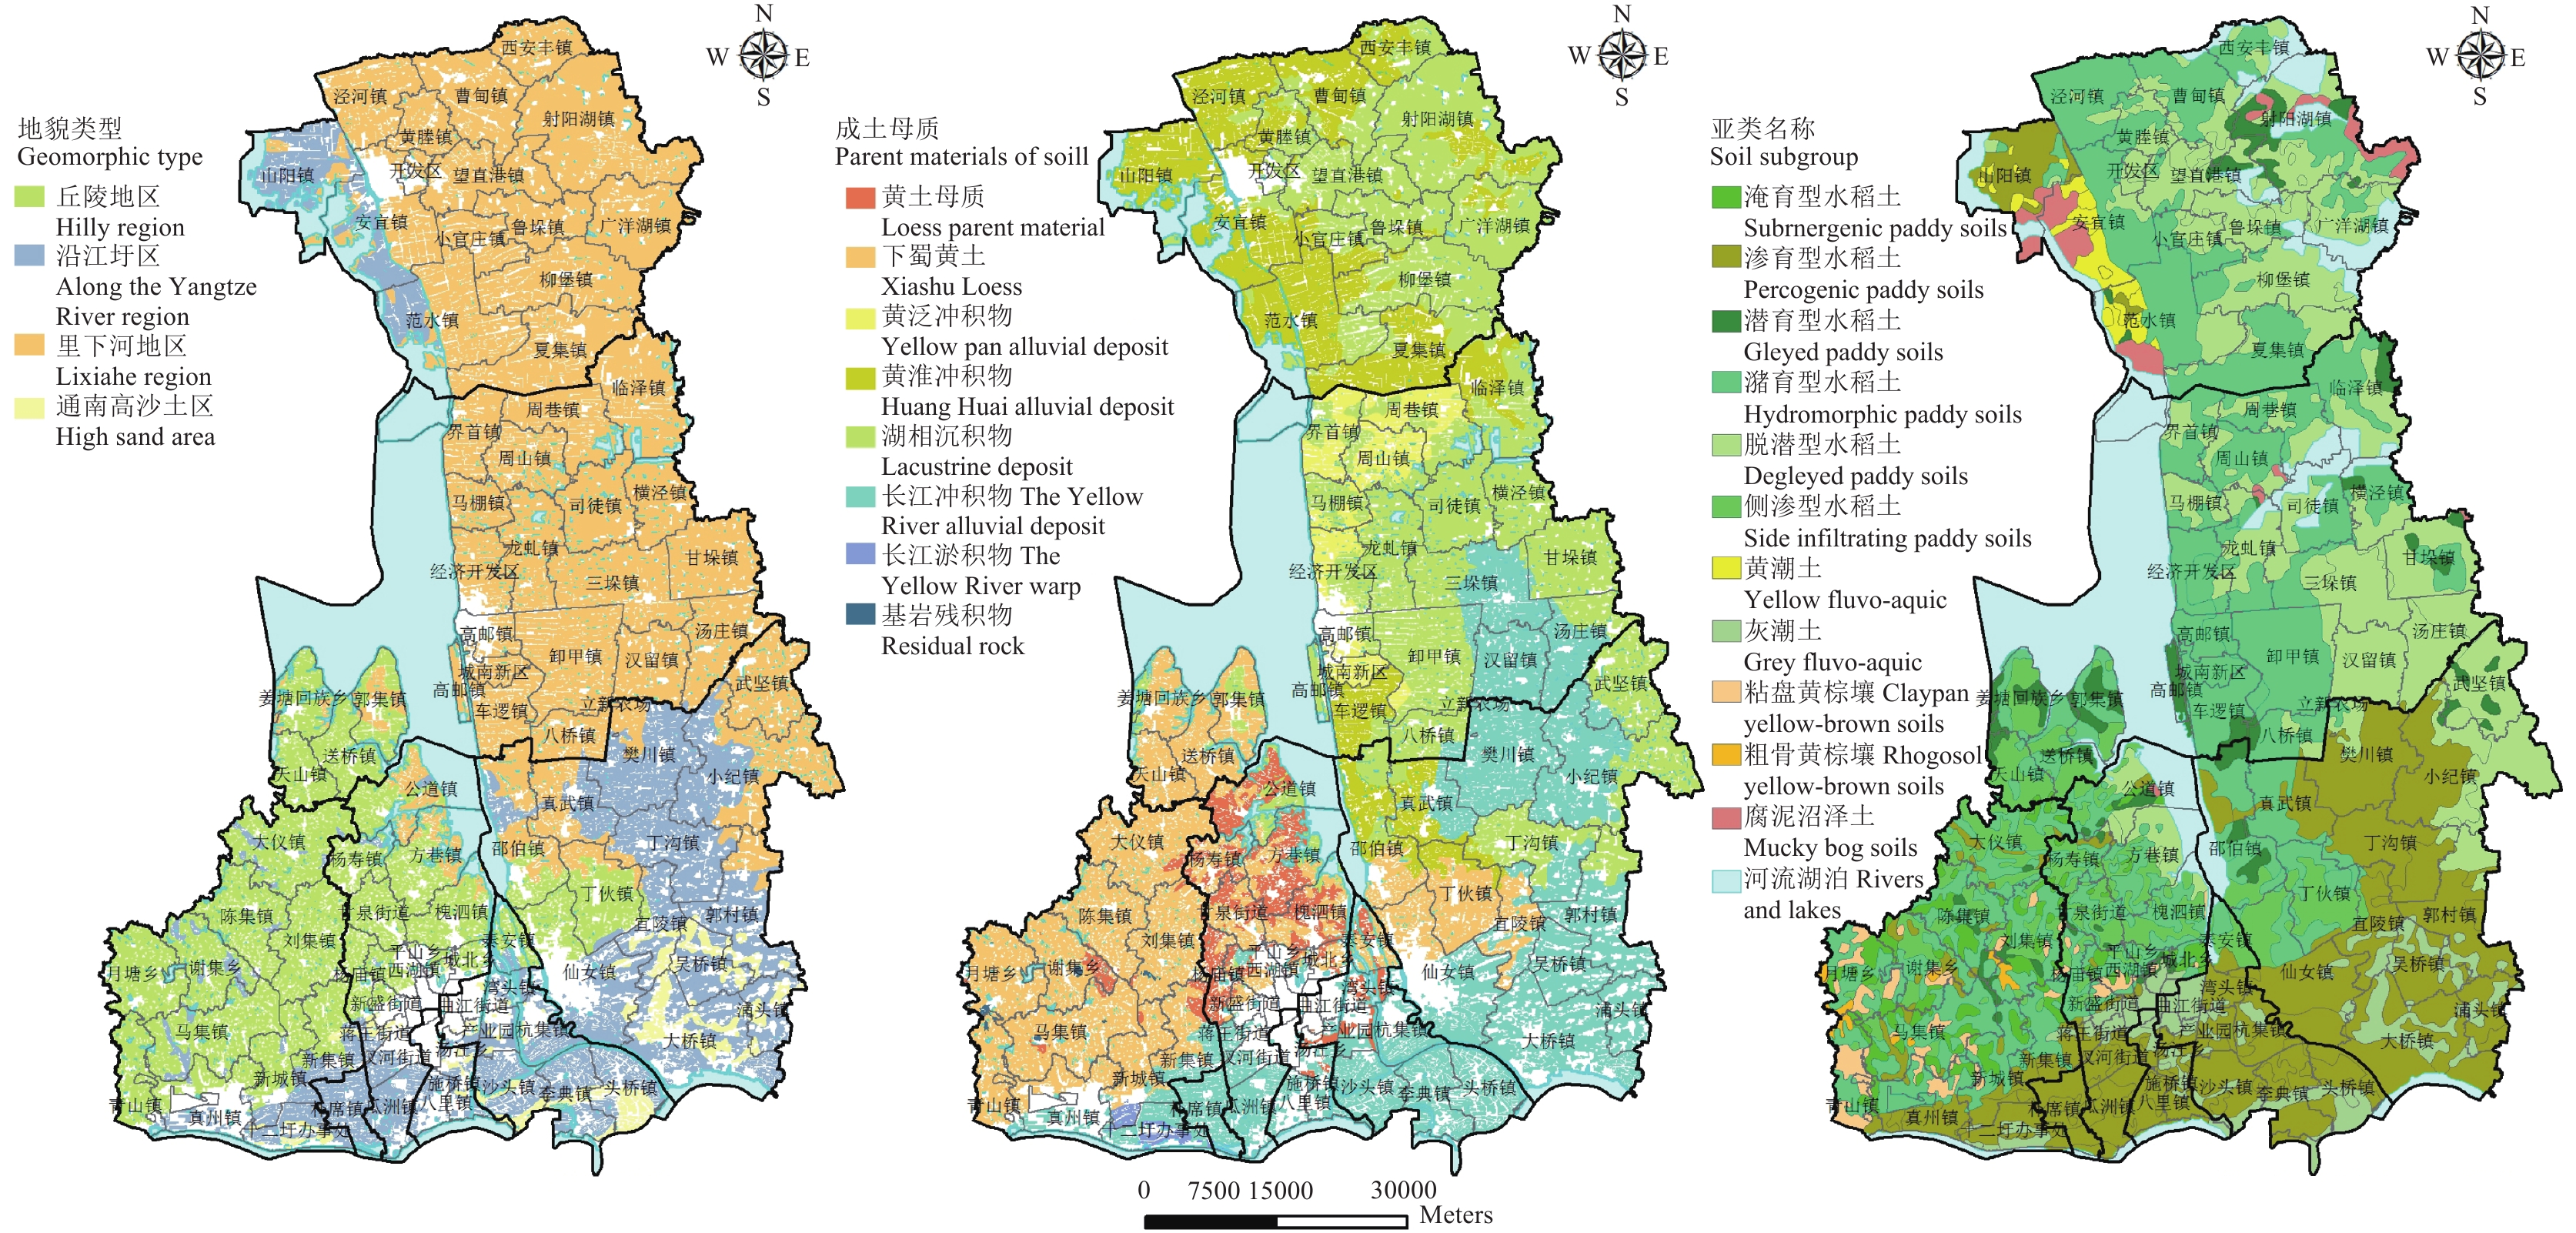 |
| 图1 扬州市地貌类型 (左)、成土母质 (中)、土壤 (亚类) 类型 (右) Fig. 1 Soil geomorphic type (left), parent material(middle) and eomorphic type (subgroup, right) in Yangzhou City |
自 1984 年第二次土壤普查以来,扬州市每 5~10 年统一组织土壤农化性状的普查,采样时尽可能与第二次土壤普查采样点一致,采样深度为 0—20 cm。为了达到本研究的目的,本文以 1984 年第二次土壤普查的农化样点 (4107 个) 为基础,以 10 年作为一个时间周期来研究耕地主要土壤养分的变化趋势,共选取了 1994 年的土壤普查点 (2862 个)、2005 年土壤养分调查点 (4018 个)、2014 年土壤养分调查点 (6009 个),包含各取样点位的地貌类型、成土母质、土壤类型、质地、施肥情况等土壤属性信息 (图 2)。
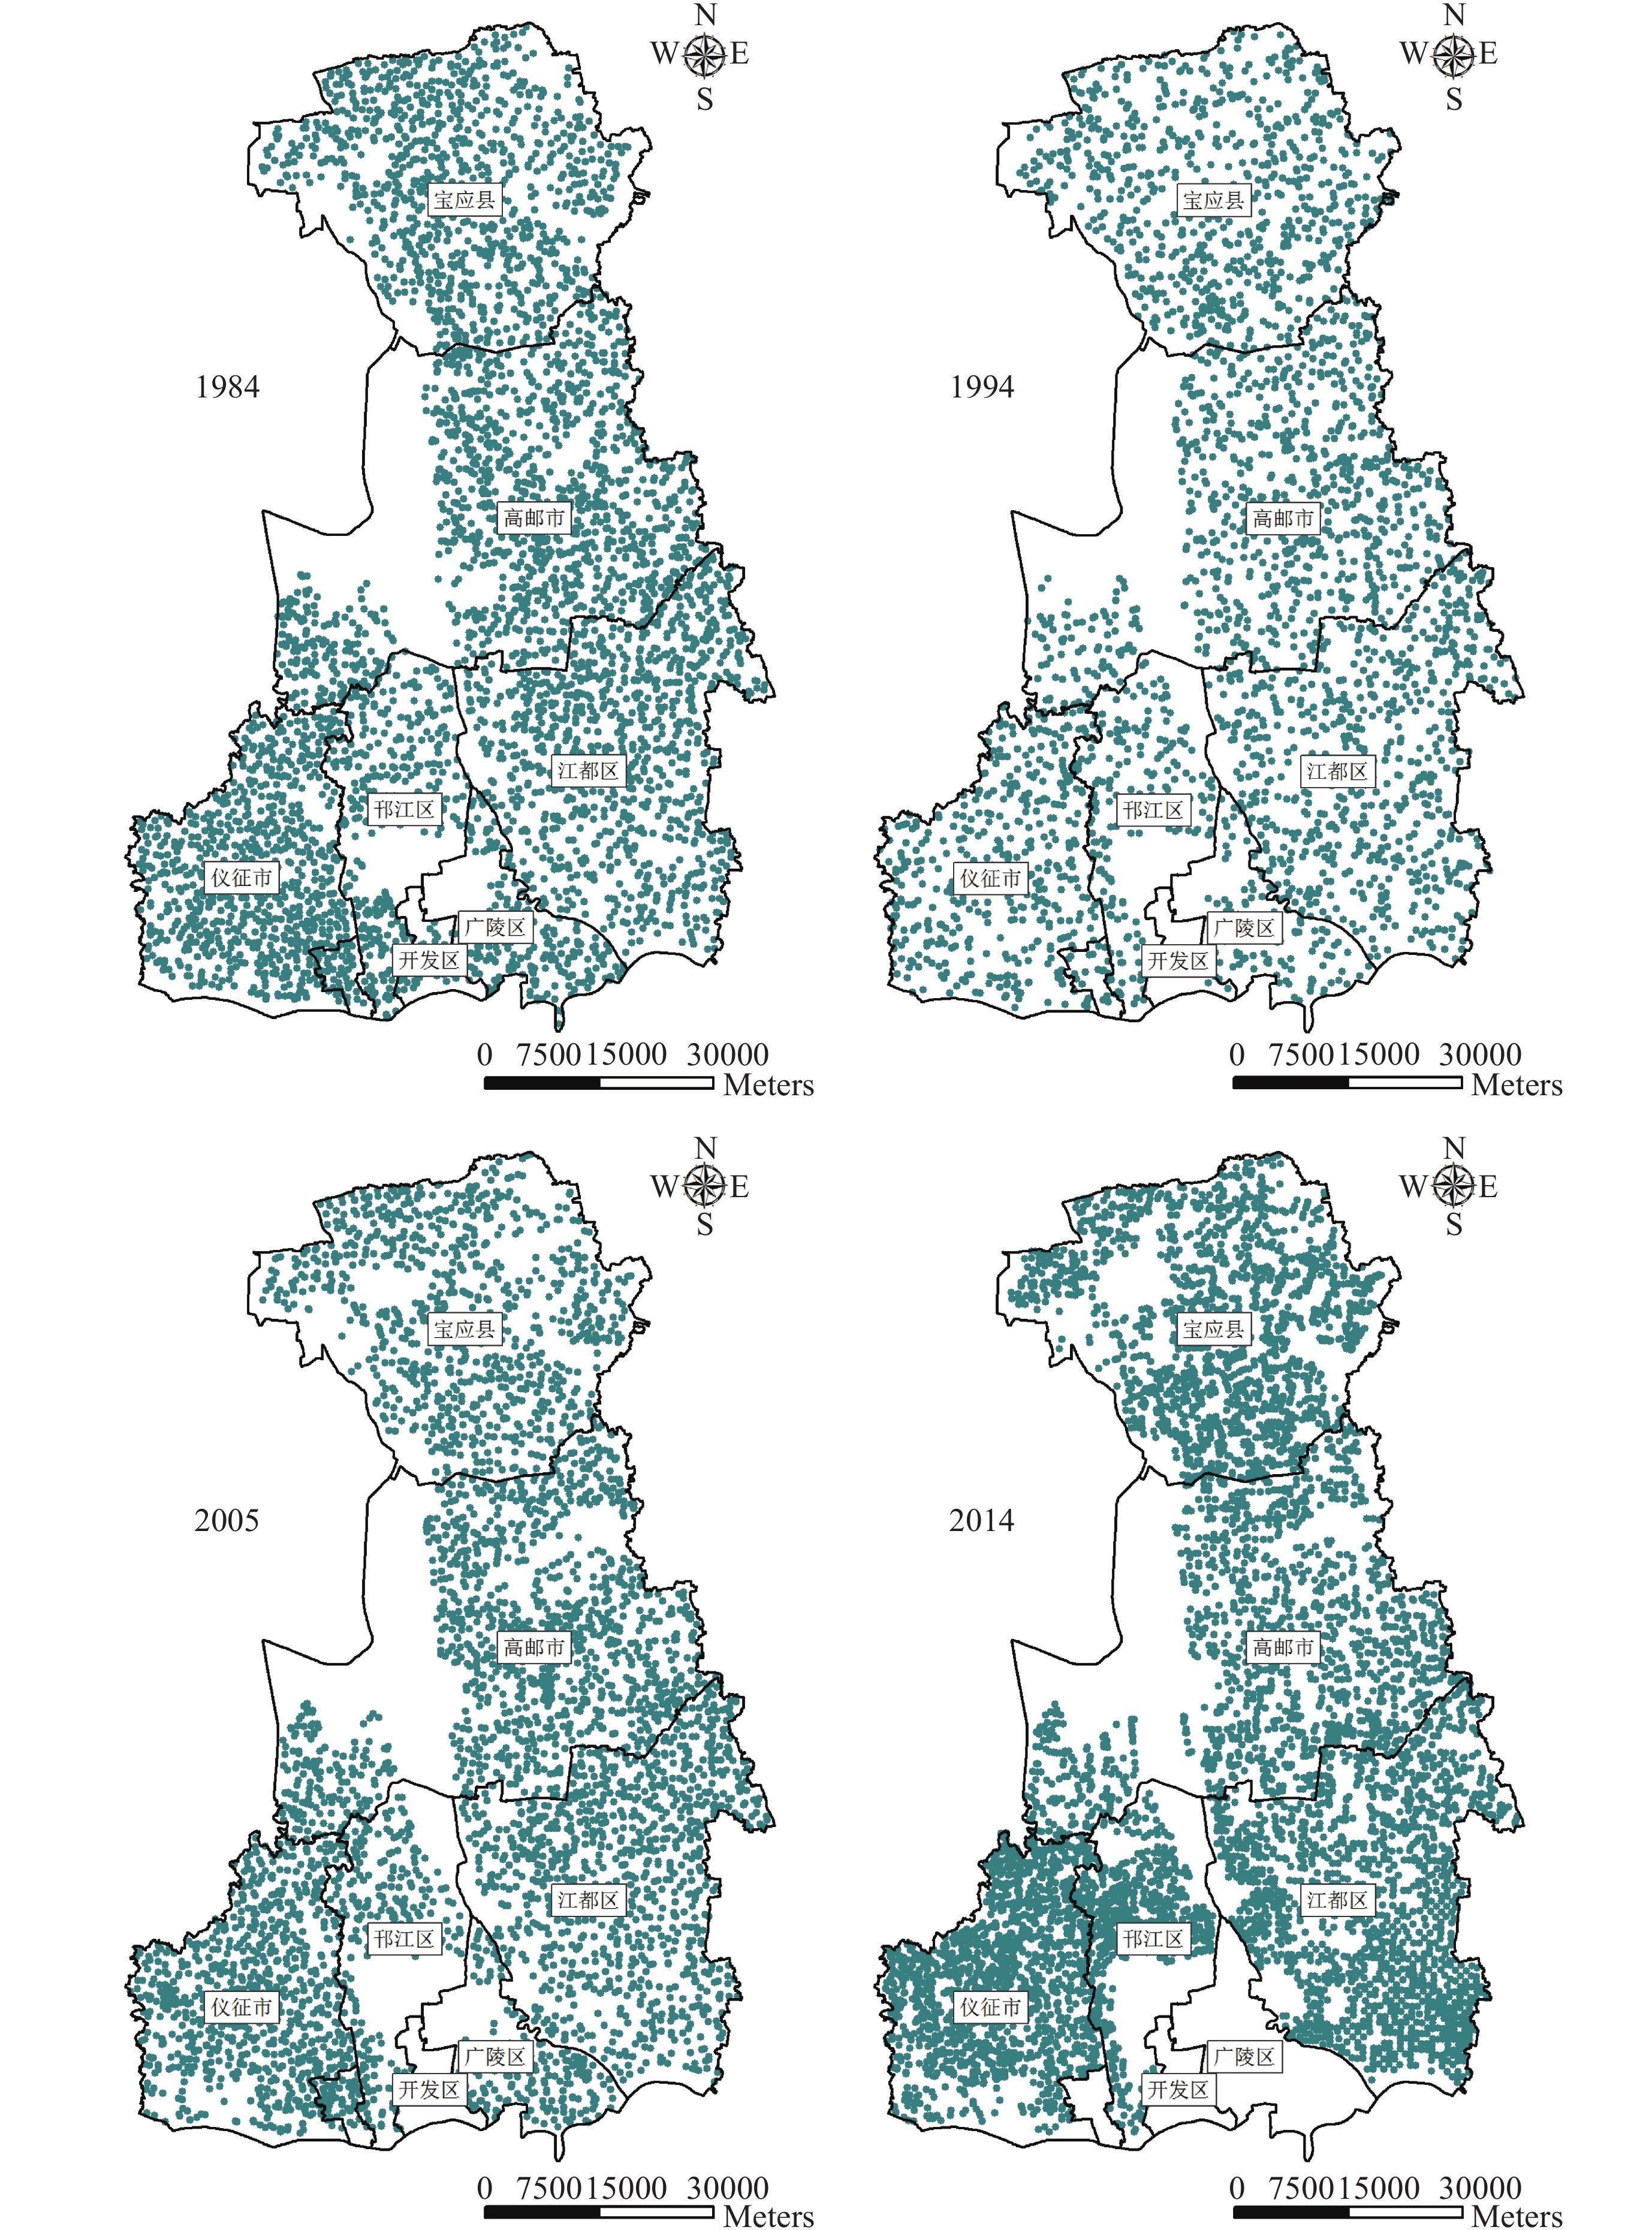 |
| 图2 历年扬州市土壤养分普查点分布图 Fig. 2 Soil sampling sites in the soil surveys in Yangzhou City |
为了增加数据的可比性和可靠性,历次土壤普查的测定方法相同,均采用中国土壤学会编写的《土壤农业化学分析方法》的测定标准[21]。
应用地统计学中克里格法 (Kriging) 和相关的统计学方法,采用 ArcGIS10.1、SPSS19 等软件进行数据统计分析。参照《中国土壤》[22]对我国土壤酸碱度分级指标将扬州市耕地土壤 pH 值分为 5 级,分别为 Ⅰ 级 (> 7.5)、Ⅱ 级 (6.5~7.5)、Ⅲ 级 (5.5~6.5)、Ⅳ 级 (4.5~5.5)、Ⅴ 级 (< 4.5)。
2 结果与分析 2.1 不同年份土壤 pH 演变趋势由表 1 可见,1984 年、1994 年、2005 年、2014 年土壤 pH 均值分别为 7.51、7.07、6.83 和 6.74,30 年间耕地土壤 pH 呈持续下降趋势,四个时期土壤 pH 的分布类型均表现为对数正态分布或正态分布,说明四个时期的数据都满足地统计学理论中有关特征假设。1984 年至 2014 年 pH 平均从 7.51 减少为 6.74,降低了 0.77 个单位,表明土壤呈酸化趋势。四个时期的土壤 pH 的变异系数差异不大,变异系数在 9.3%~14.0%。
| 表1 不同年份耕层土壤 pH 值的统计特征值 Table 1 Statistical characteristics of soil pH from 1984 to 2014 |
 |
应用 Kriging (地理信息系统软件 ArcGIS10.3) 进行最优内插法,形成了不同年份的土壤 pH 值分布图 (图 3) 和各级耕地分布面积统计表 (表 2)。
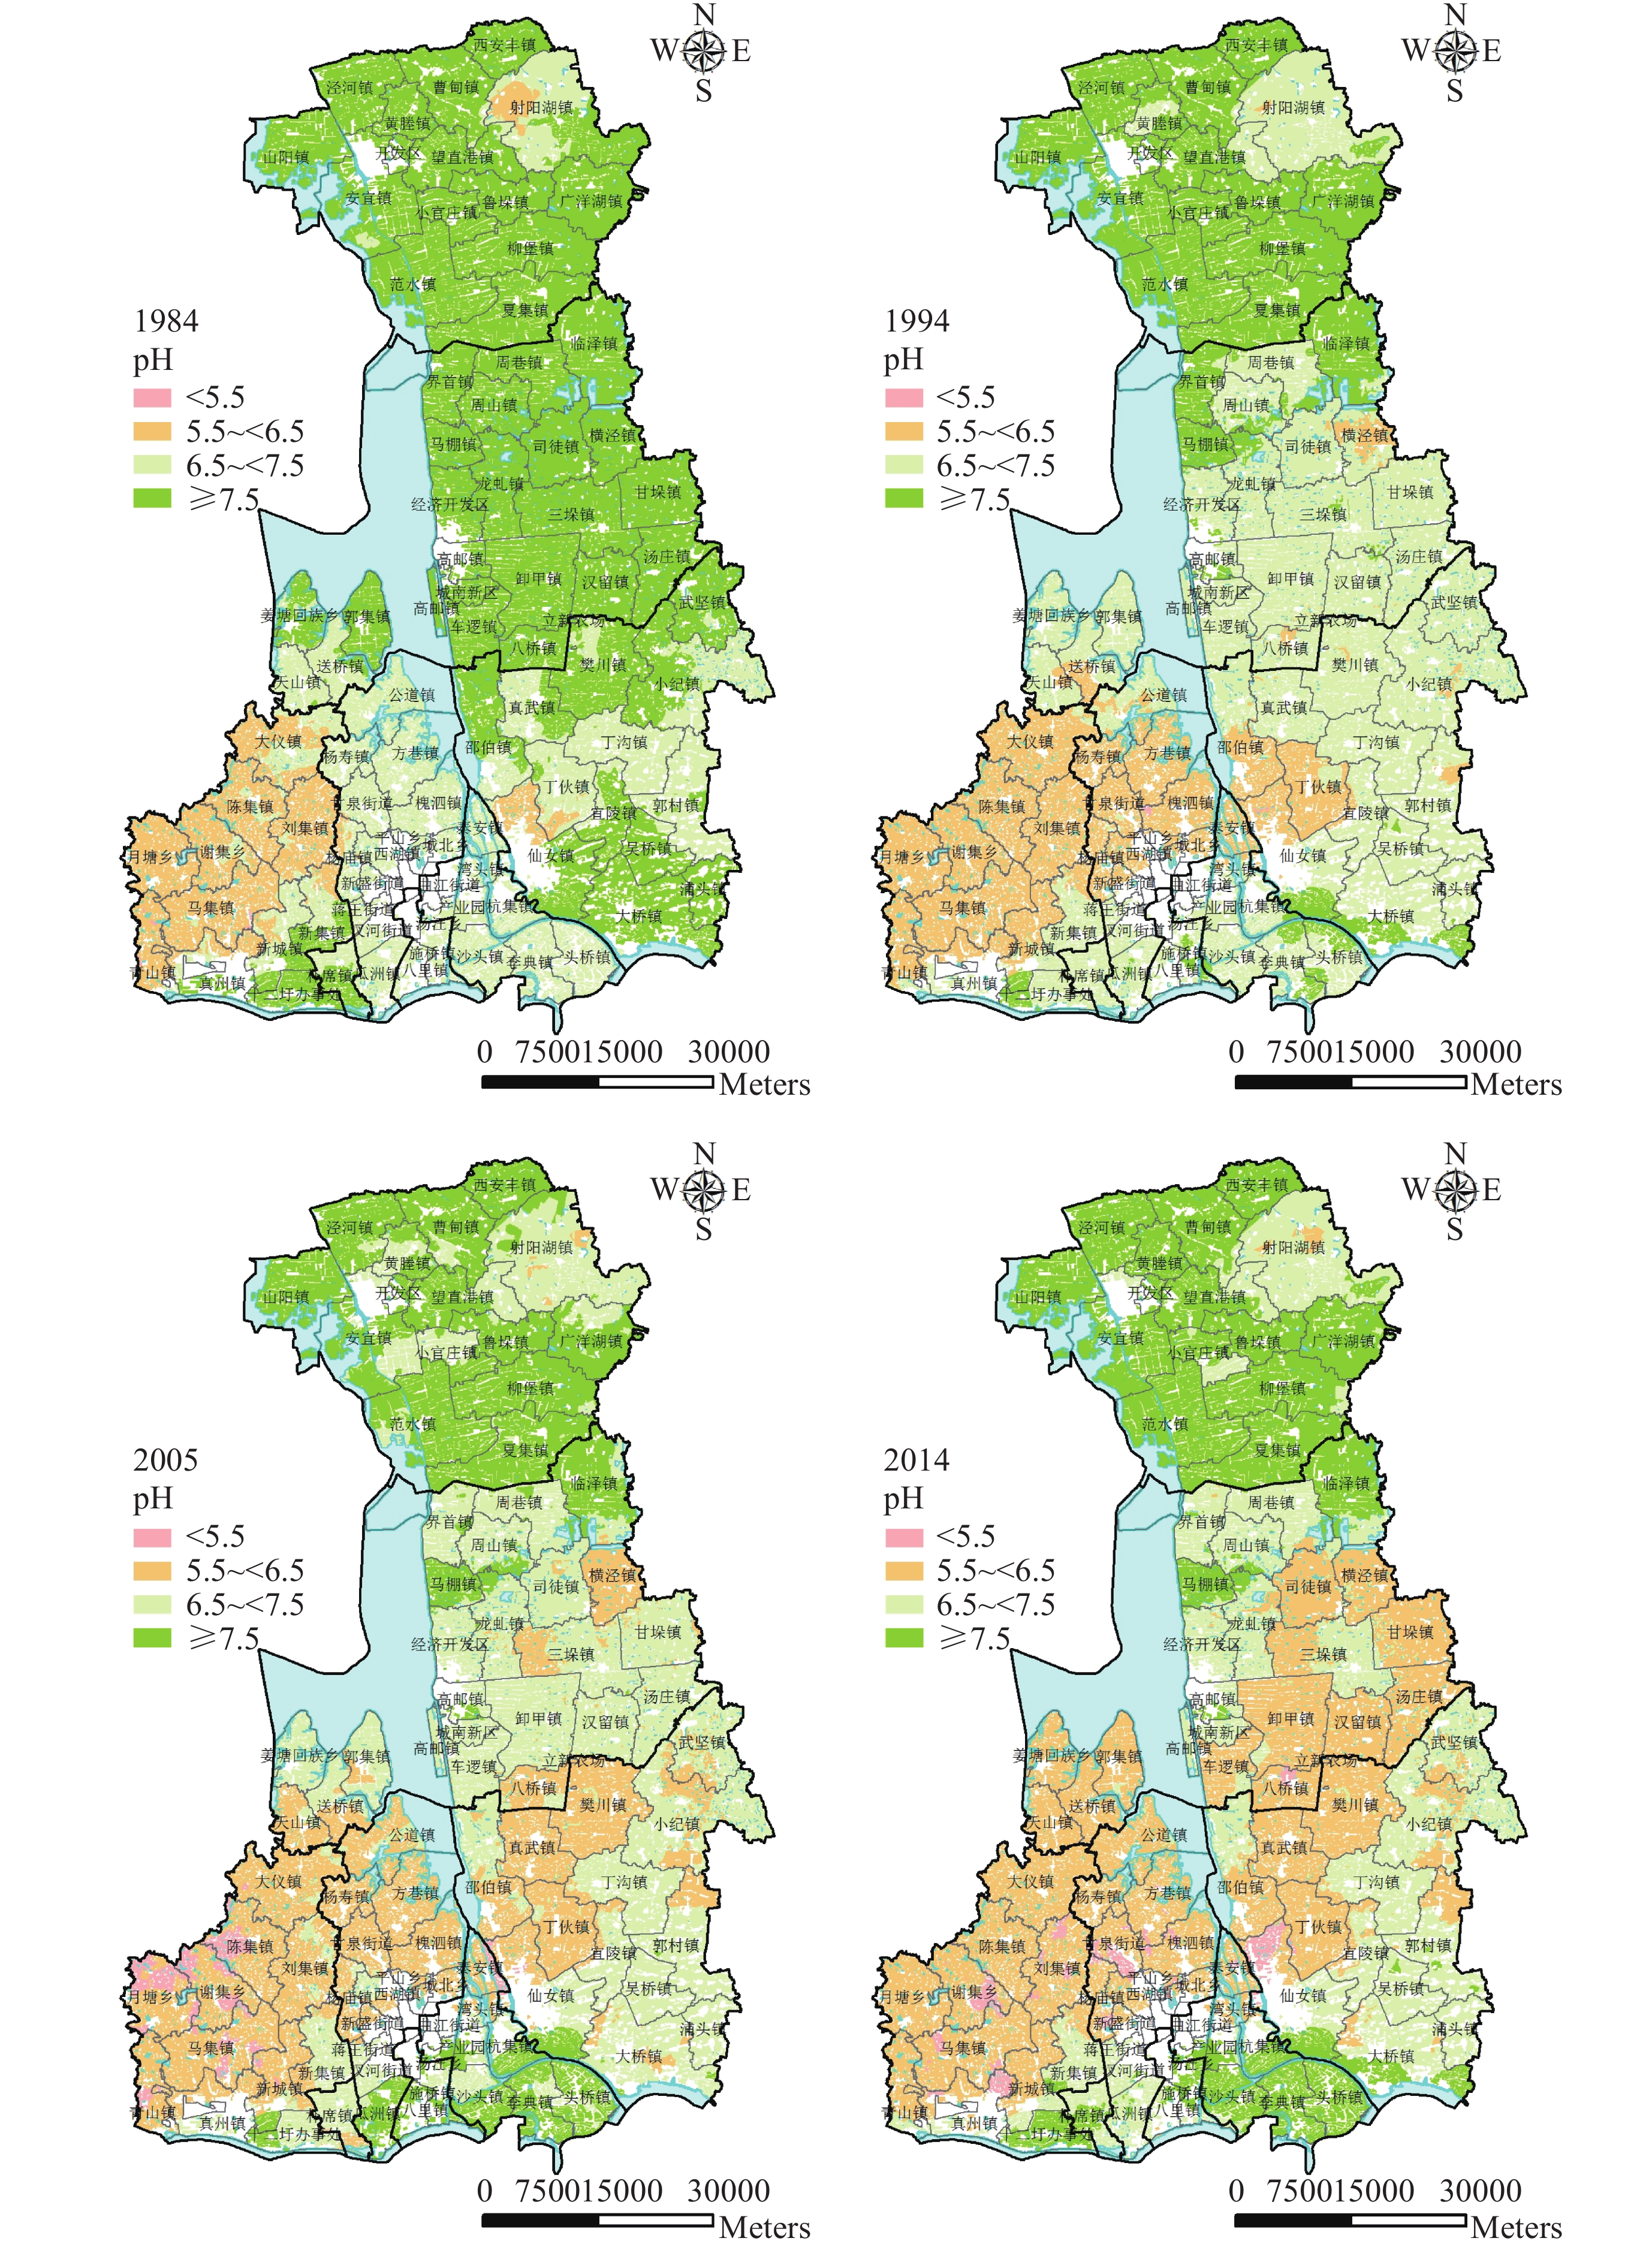 |
| 图3 1984~2014 年扬州市土壤 pH 值分布图 Fig. 3 Variation of soil pH from 1984 to 2014 in Yangzhou |
| 表2 扬州市不同 pH 级别土壤面积在耕地总面积中的百分比 Table 2 Percentage of soil area with different pH grades in the total arable land in Yangzhou |
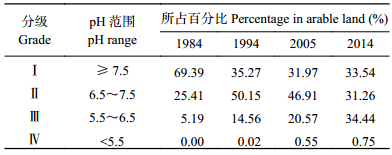 |
由图 3、表 2 可知,与 1984 年相比,1994 年土壤 pH 呈现大幅下降趋势。1994 年 Ⅰ 级的面积为 103500 hm2,占总面积 35.3%,所占比例仅为 1984 年的 50.8%;Ⅱ 级的面积为 147190 hm2,占总面积 50.2%,所占比例约为 1984 年的 2 倍;Ⅲ 级的面积为 42727 hm2,占总面积的 14.6%,所占比例接近 1984 年的 3 倍。
2005 年土壤 pH 与 1994 年相比继续下降。Ⅰ 级的面积为 92822 hm2,占总面积的 32.0%,所占比例为 1994 年 90.6%;Ⅱ 级的面积为 137666 hm2,占总面积的 46.9%,所占比例为 1994 年的 93.5%;Ⅲ 级的面积为 460363 hm2,占总面积的 20.6%,所占比例约为 1994 年 1.5 倍。
2014 年土壤 pH 与 2005 年相比呈持续下降趋势,下降幅度有所减缓。Ⅰ 级的面积为 98436 hm2,占总面积的 33.5%,所占比例与 2005 年基本持平;Ⅱ 级的面积为 137666 km2,占总面积的 31.3%,所占比例为 2005 年 66.6%;Ⅲ 级的面积为 460363 hm2,占总面积的 34.4%,所占比例超过 2005 年 1.5 倍。
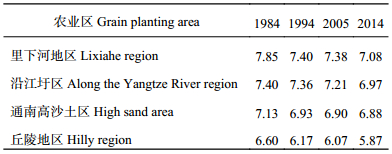
2.3 不同农业区土壤 pH 演变趋势表 3 统计数据表明,1984~2014 年四个时期扬州市不同农业区土壤 pH 均呈持续下降趋势,而其空间分布格局基本不变,表现为里下河地区 > 沿江圩区 > 通南高沙土区 > 丘陵地区。
| 表3 扬州市主要农区不同年份土壤 pH 平均值 Table 3 Averaged soil pH from 1984 to 2014 in main grain planting areas |
 |
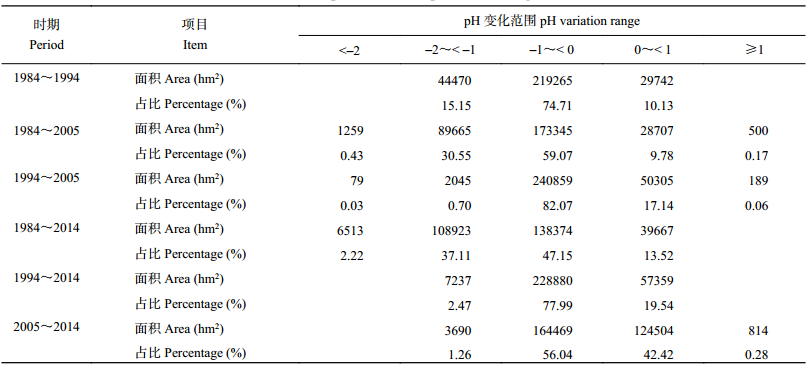
为进一步研究区域土壤 pH 变化趋势,本文对四个时期土壤 pH 分布图层间进行了图层空间差减提取比较分析 (图 4、表 4)。结果表明,1984~2014 年 30 年间,土壤 pH 整体呈下降趋势。如图 4 所示,2014 年与 1984 年相比下降大于 1 个单位的面积占研究区面积的 39.3%,下降 0~1 个单位占研究区面积的 47.2%;研究区土壤 pH 整体呈下降趋势,其中丘陵地区、通南高沙土区、里下河北部下降较快,沿江圩区、里下河区南部相对稳定。1984~2005 年间土壤 pH 值下降趋势最显著,下降 0~2 个单位的占研究区面积的 80% 以上;研究区整体下降明显,其中丘陵地区、通南高沙土区、里下河区下降较快,沿江圩区相对稳定,2005 年以后的 10 年土壤 pH 呈稳定趋势。
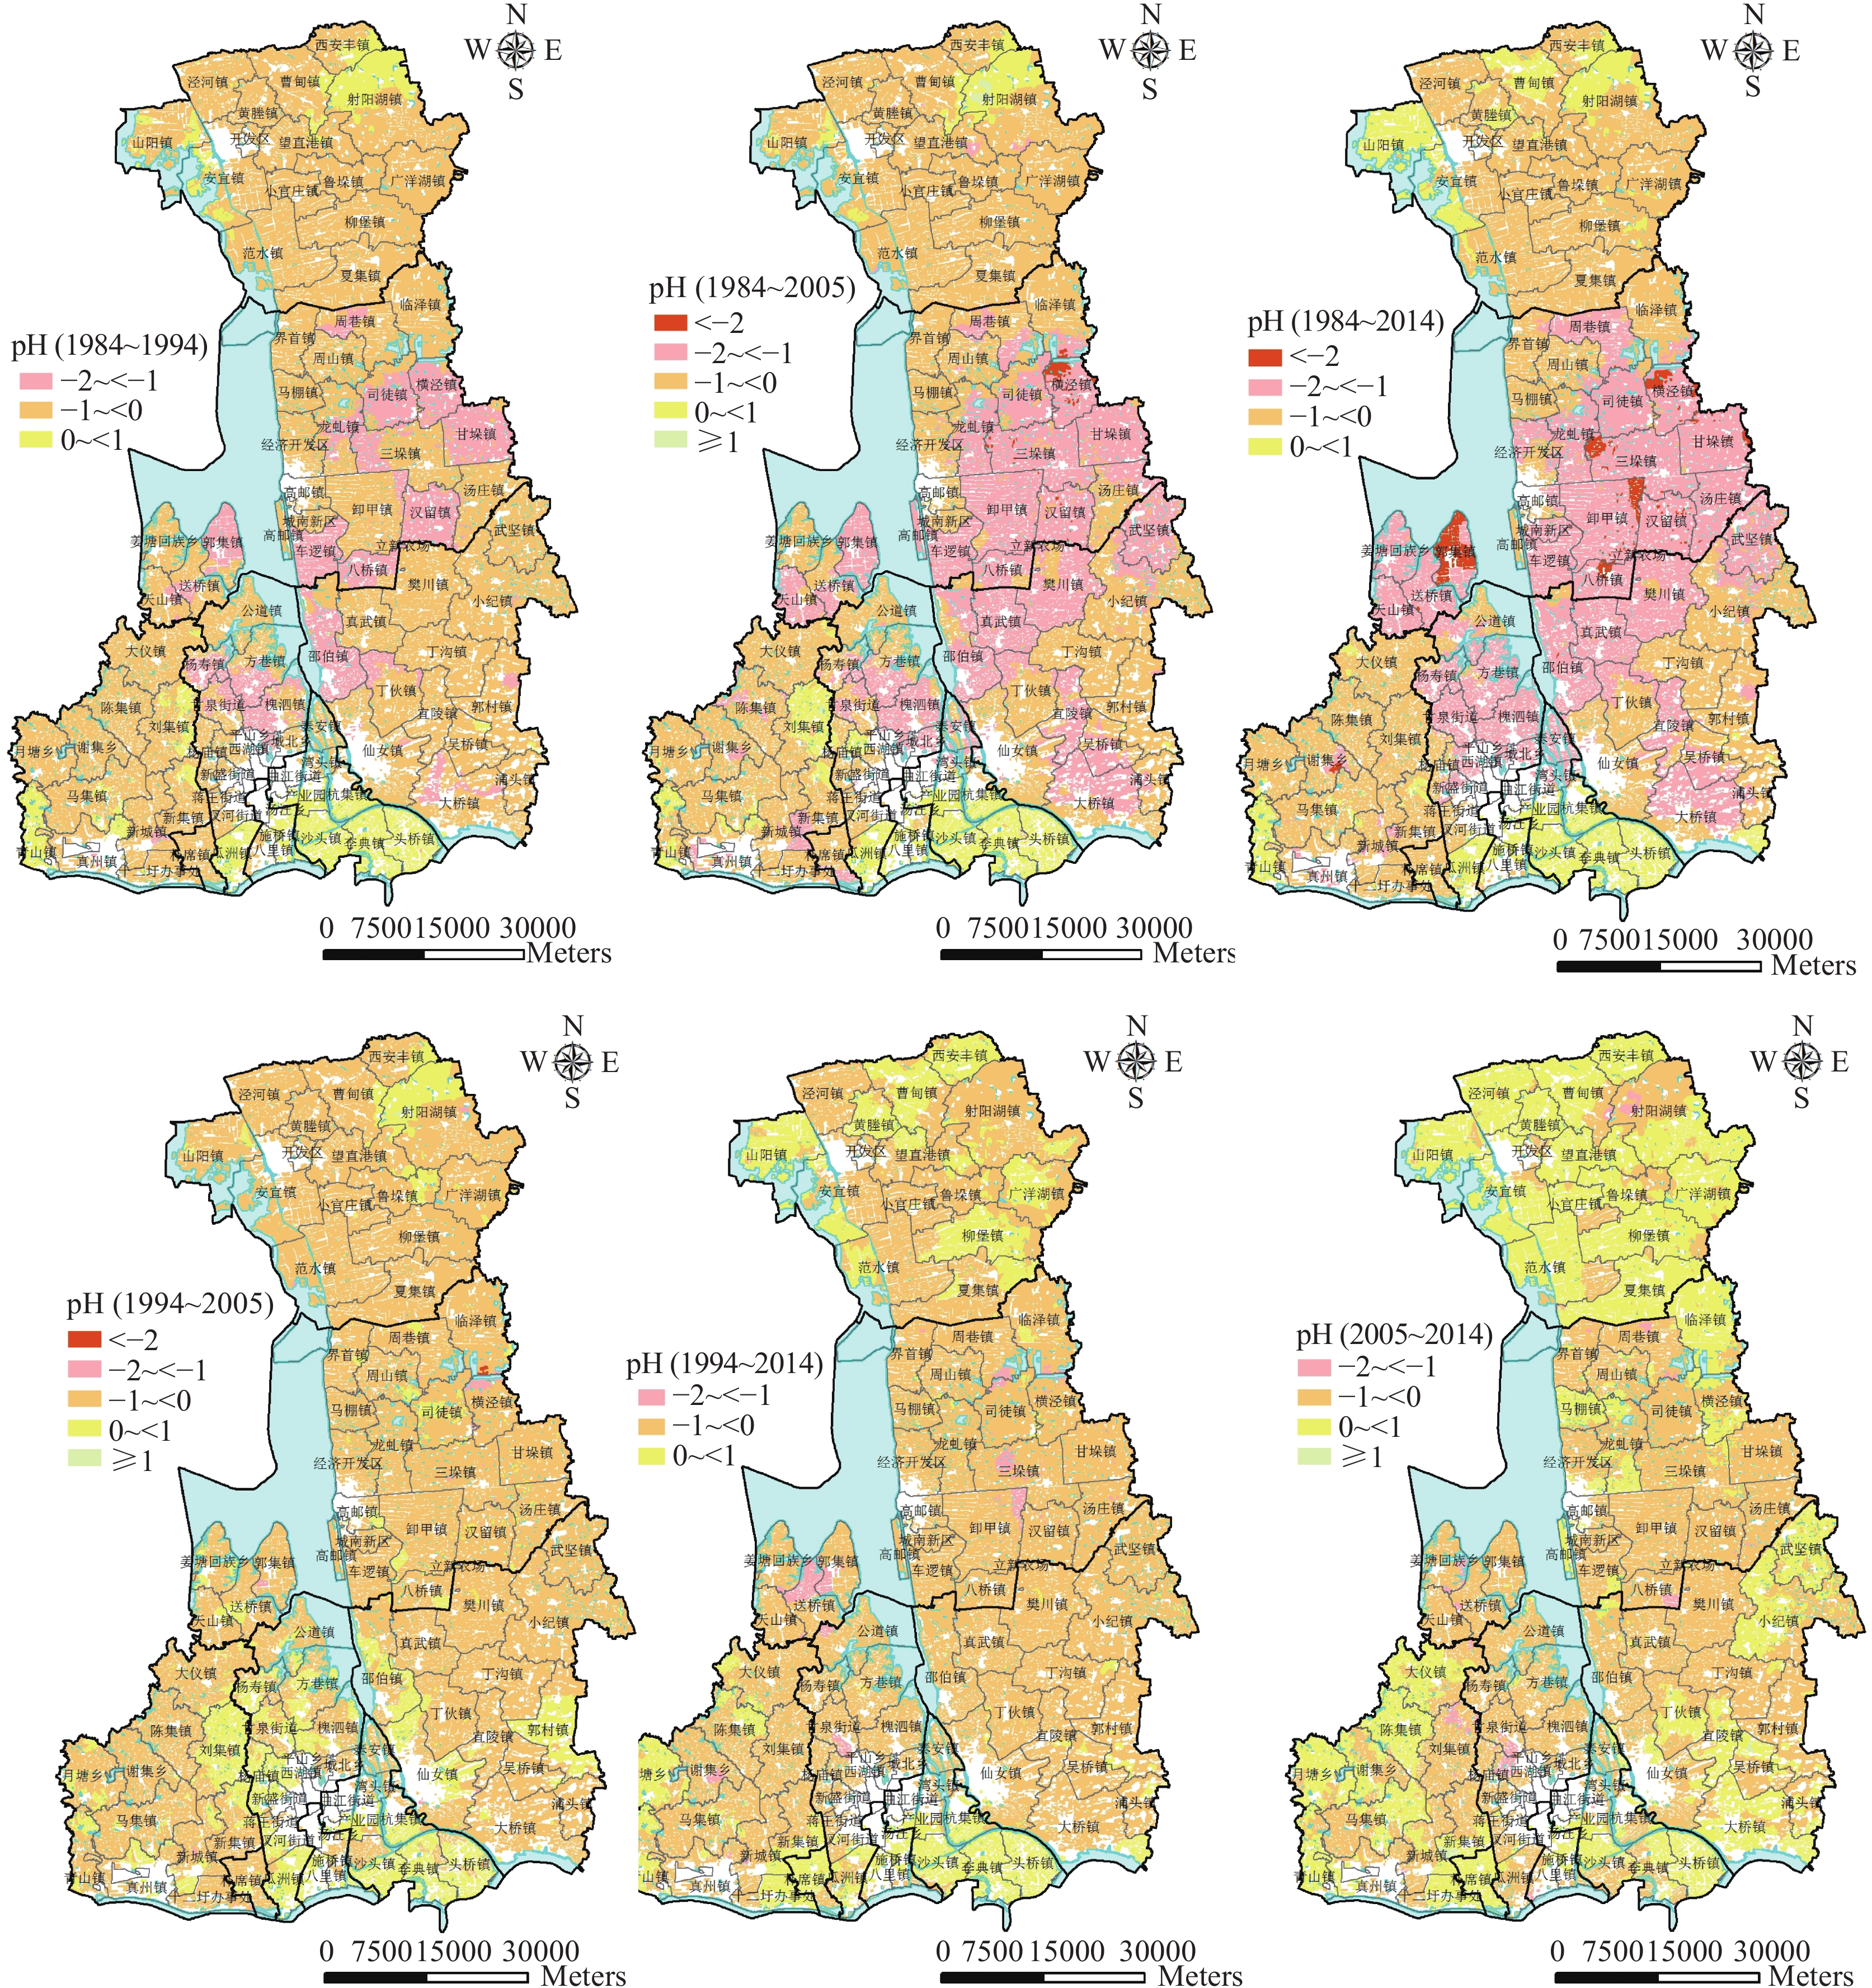 |
| 图4 扬州市不同时期土壤 pH 变化状况 Fig. 4 Variation of soil pH in different periods in Yangzhou |
| 表4 扬州市不同时期土壤 pH 值 Table 4 Soil pH in different periods in Yangzhou |
 |
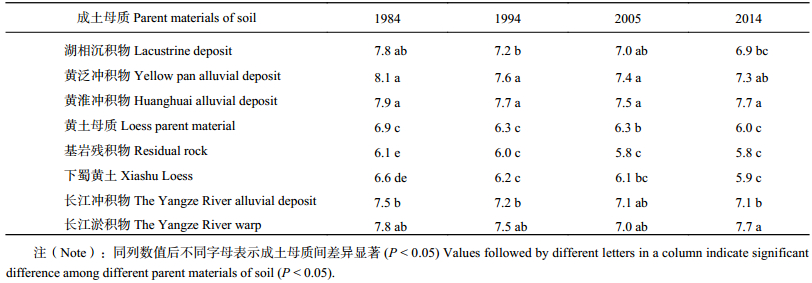
土壤母质是形成土壤的物质基础,在生物、气候条件相同的情况下,土壤母质对土壤性质、土壤肥力特征、土壤类型分布起着决定性的作用。本研究区域共有 8 种成土母质,通过对 1984 年、1994 年、2005 年、2014 年成土母质之间的比较 (表 5) 可知,成土母质对土壤 pH 空间分布有很大的影响,碱性基岩母质上发育的土壤 pH 比酸性基岩形成的土壤高。随着时间的推移,8 种成土母质土壤 pH 含量均呈下降的趋势但下降的速度有所不同,下降最快的是湖相沉积物,30 年下降了 0.9 个单位;其次是下蜀黄土,下降了 0.7 个单位。长江淤积物、长江冲积物和黄淮冲积物相对变化较小。
| 表5 不同成土母质下土壤 pH 在 1984~2014 年间的变化 Table 5 Variation of soil pH from 1984 to 2014 under different parent materials of soil |
 |
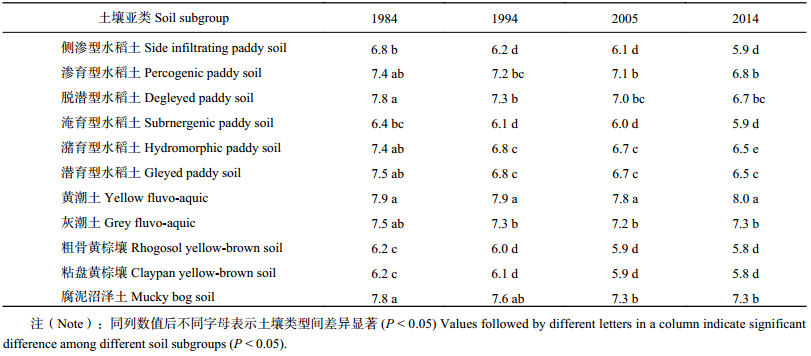
研究区土壤类型分为水稻土、潮土、黄棕壤、沼泽土 4 个土类,水稻土面积最大,占耕地面积的 78.24%,共有 11 个土壤亚类。通过对 1984 年、1994 年、2005 年、2014 年 pH 值的对比可知 (表 6),不同土壤类型对土壤 pH 有显著影响,总体呈下降趋势。其中水稻土 pH 下降幅度最大,平均下降 0.8 个单位,可见水稻土 pH 整体下降对扬州市耕地土壤 pH 30 年整体下降起主导作用,这与王志刚等[6]的研究是一致的。
| 表6 土壤 pH 随土壤类型的变化状况 (1984~2014) Table 6 Variation of soil pH as affected by soil subgroups from 1984 to 2014 |
 |
土壤有机质周转和累积是土壤–植物–气候系统中的生态平衡现象,其周转过程是在土壤微生物的参与下进行的,受到各种自然和人为因素的影响。土壤酸碱度是土壤的属性,对微生物数量、种类及其生物活性有重要影响[23–24],因此土壤酸碱度会对土壤有机质变化产生影响[1, 25–28]。研究区 30 年耕地土壤有机质平均含量 (图 5) 由 21.62 g/kg 上升到 27.63 g/kg,增幅达 27.8%。土壤有机质含量增加促使土壤中的微生物对有机质进行分解,产生的 CO2 溶于水后形成碳酸使土壤整体酸化。这也是土壤 pH 30 年整体下降的原因之一。30 年来土壤有机质变化与土壤 pH 变化呈负相关关系,这与朱小琴等[1]及戴万宏等[28]的研究是一致的。
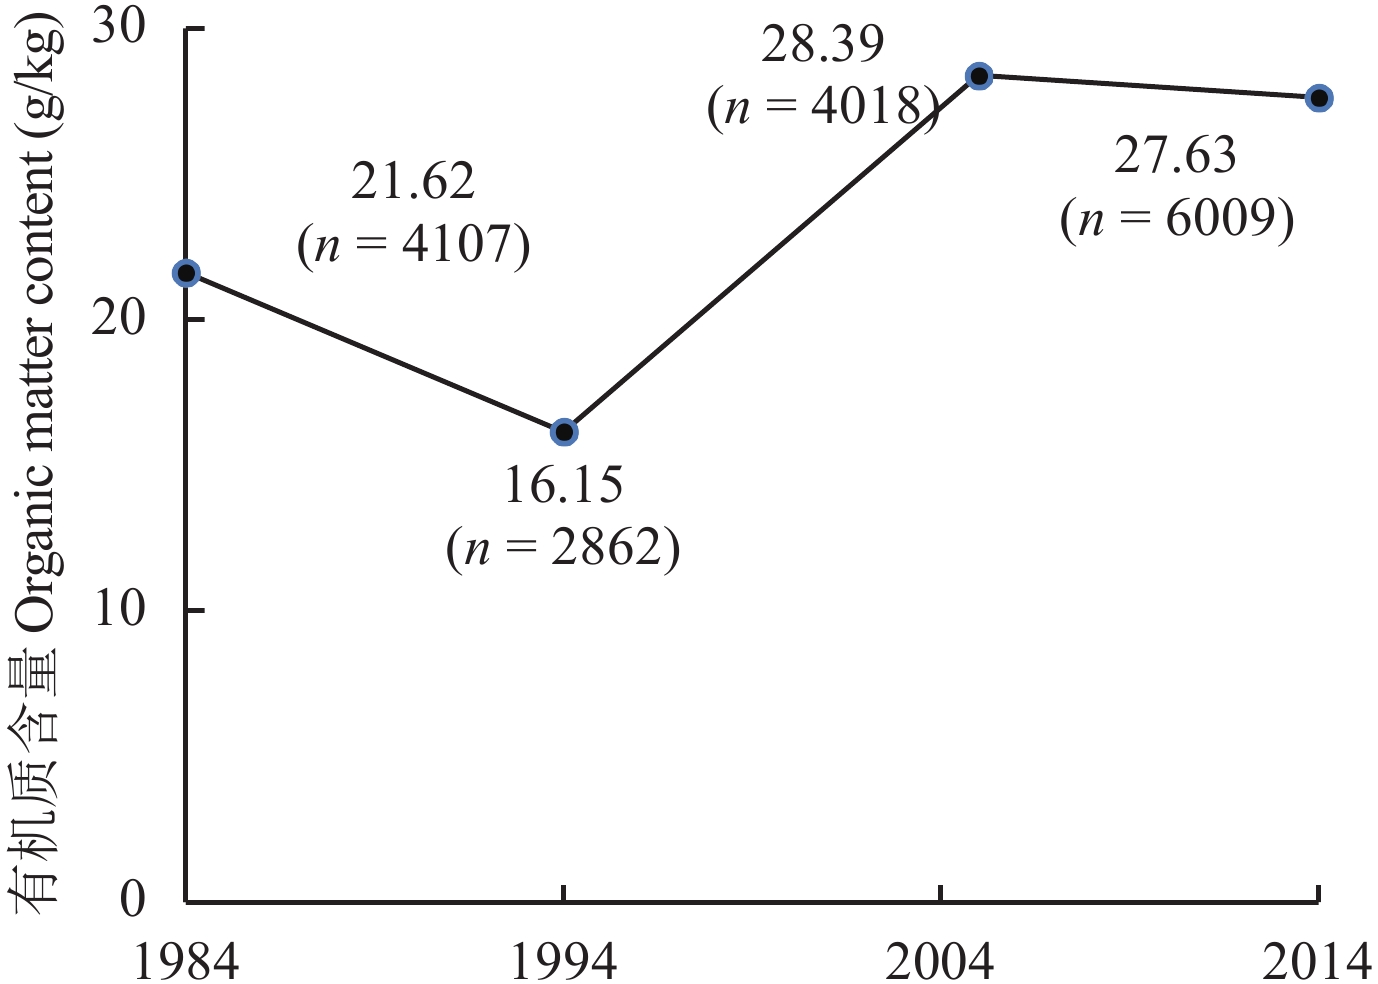 |
| 图5 1984~2014 年土壤有机质平均含量变化 Fig. 5 Content variation of soil organic matter in Yangzhou from 1984 to 2014 |
酸雨是引起土壤 pH 下降的一个重要因素[29]。酸性降雨的酸化作用,在短期内导致土壤潜在酸的增长,经常性的酸雨会导致土壤 pH 的下降。扬州市 2000 年开始设立酸雨监测站。通过对 2000~2014 年降水数据分析 (图 6) 可知,扬州市降水 pH 值呈下降趋势。丘陵、沿江圩区下降最快,这主要是由于位于仪征境内的扬州化学工业园离丘陵、沿江地区距离较近,其大气污染物主要是氯气、氯化氢等,陆地空气污染对降水 pH 影响较大[30],是研究区域中丘陵、沿江圩区土壤 pH 下降较快的主要因素之一。
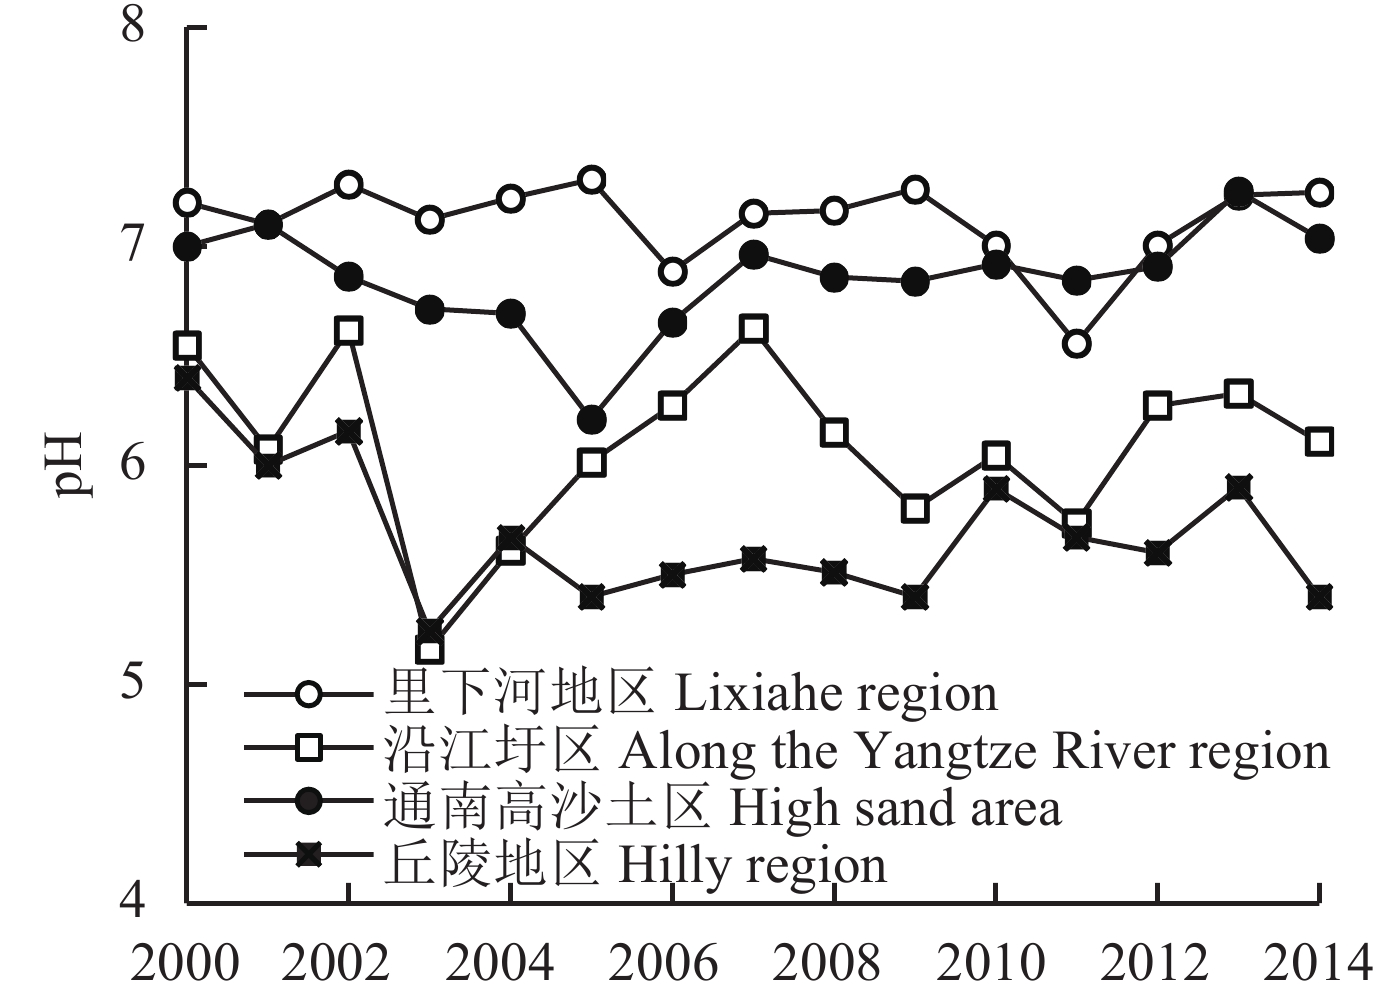 |
| 图6 扬州市 2000~2014 年降雨的 pH 变化 Fig. 6 pH of rainfall from 2000 to 2014 in Yangzhou |
从图 7 可以看出,1984 年以后扬州市化肥用量持续大幅度增加,2005 年化学肥料投入量约 505300 吨,比 1984 年化肥投入量增加了 2.42 倍;2005~2014 年后 10 年化肥投入量呈稳定趋势,2006 年化肥投入量达到最大值约 521500 吨,其中 2014 年化肥投入量约 468900 吨,较 2005 年下降了 7.76%。化肥的种类主要为氯化钾、硫酸铵、过磷酸钙等生理酸性肥料,长期大量施用这些酸性肥料会造成土壤 pH 下降。扬州市 30 年化肥投入量与土壤 pH 变化呈高度的负相关,长期过量施用化肥是造成土壤 pH 全面下降的主要驱动因子。而丘陵地区土壤 pH 下降较快的主要原因是由于旱地土壤施入过多的化肥后得不到冲洗,致使土壤酸碱度缓冲性能下降,导致土壤酸化的加速,扬州丘陵地区从 20 世纪 80 年代开始推广使用低含量的复合肥,到 2014 年,扬州丘陵地区低含量复合肥的年使用量达到 4 万吨以上,年均用量超过 1000 kg/hm2。
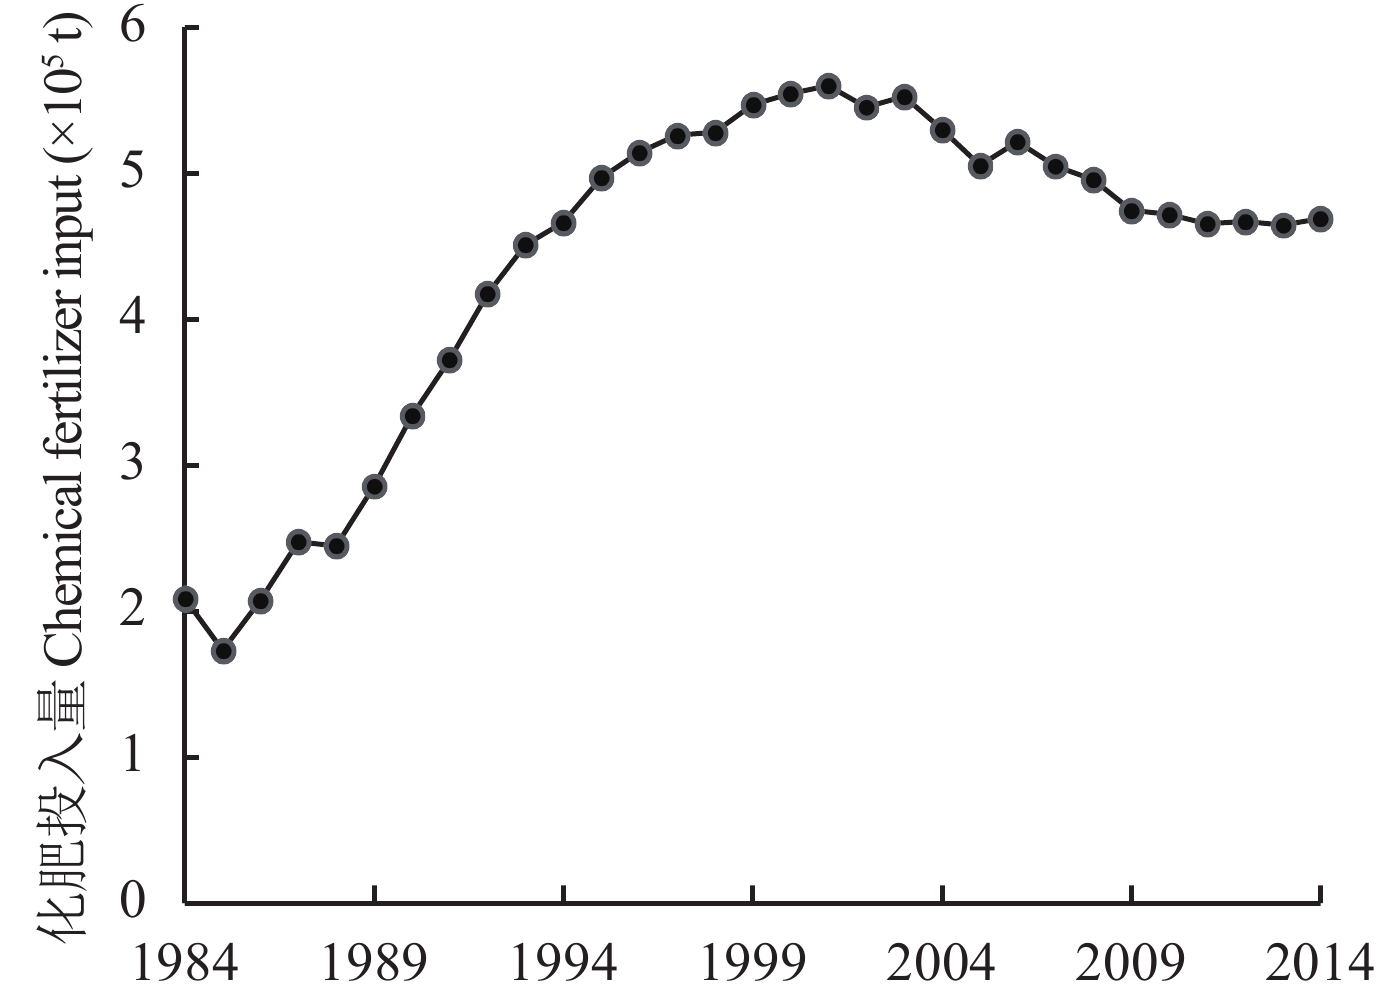 |
| 图7 扬州市 1984~2014 年化肥投入量 Fig. 7 Chemical fertilizer input in Yangzhou from 1984 to 2014 |
扬州市是国家重要商品粮基地。土地利用主要以种植稻麦为主,但近年来全面实行种植业结构调整与优化,大力发展高效农业、特色农业,蔬菜种植面积不断扩大,复种指数也不断增加。据扬州市耕地质量保护的调查与统计,2014 年蔬菜种植面积比 2005 年增加了 20.5%,设施蔬菜复种指数高,化肥投入量偏多,据测定种植大棚蔬菜的田块土壤 pH 平均值比周边种植稻麦田块下降 1.5~2 个单位,这是导致部分地区土壤 pH 下降较快的主要因素,这与朱小琴等[1]的研究是一致的。
4 结论2014 年土壤 pH 均值 6.74,比 1984 年下降 0.77 个单位,30 年间耕地土壤 pH 呈持续下降趋势,其中前 20 年下降较快,后 10 年呈稳定趋势。2014 年土壤 pH 空间分布以 Ⅱ 级、Ⅲ 级为主,占总面积的 65.7%;1994 年、2005 年土壤 pH 空间分布都以 Ⅰ 级、Ⅱ 级为主,占总面积的 75% 以上;1984 年土壤 pH 空间分布都以 Ⅰ 级、Ⅱ 级为主,占总面积的 90% 以上。30 年间土壤 pH 下降 0~1 个单位的面积最大,占总面积的 47.15%;下降大于 1 个单位的面积占总面积的 39.33%。前 20 年土壤 pH 值下降严重,下降了 0~2 个单位的面积占 80% 以上,后 10 年呈稳定趋势。
总之,影响土壤 pH 时空演变的驱动因子主要有成土母质、土壤类型、土壤有机质、酸雨、施肥等。其中成土母质、土壤类型、土壤有机质含量主要影响土壤 pH 空间分布;酸雨、施肥及土地利用类型影响土壤 pH 时间分布,酸雨、施肥是导致土壤酸化的主要驱动因子。
| [1] |
朱小琴, 孙维侠, 黄标, 等. 长江三角洲城乡交错区农业土壤pH特征及影响因素探讨—以江苏省无锡市为例[J].
土壤学报, 2009, 46(4): 594–602.
Zhu X Q, Sun W X, Huang B, et al. pH characters of agricultural soil in peri-urban areas of the Yangtze River delta region and their affecting factors—a case study of Wuxi City, China[J]. Acta Pedologica Sinica, 2009, 46(4): 594–602. |
| [2] | Bedrna Z. Resistibility of landscape to acidification[J]. Ekologia, 2007, 13: 77–86. |
| [3] | Black A S. Soil acidification in urine-and urea affected soil[J]. Australian Journal of Soil Research, 2002, 30: 989–999. |
| [4] |
胡宁, 娄翼来, 张晓珂, 等. 保护性耕作对土壤交换性盐基组成的影响[J].
应用生态学报, 2010, 21(6): 1492–1496.
Hu N, Lou Y L, Zhang X K, et al. Effects of conservation tillage on the composition of soil exchangeable base[J]. Chinese Journal of Applied Ecology, 2010, 21(6): 1492–1496. |
| [5] |
苏有健, 王烨军, 张永利, 等. 不同植茶年限茶园土壤pH缓冲容量[J].
生态学报, 2014, 25(10): 2914–2918.
Su Y J, Wang Y J, Zhang Y L, et al. Soil pH buffer capacity of tea garden with different planting years[J]. Chinese Journal of Applied Ecology, 2014, 25(10): 2914–2918. |
| [6] |
王志刚, 赵永存, 廖启林, 等. 近20年来江苏省土壤pH值时空变化及其驱动力[J].
生态学报, 2008, 28(2): 720–727.
Wang Z G, Zhao Y C, Liao Q L, et al. Spatial-temporal variation and associated affecting factors of soil pH in the past 20 years of Jiangsu Province, China[J]. Acta Ecologica Sinica, 2008, 28(2): 720–727. |
| [7] |
郭治兴, 王静, 柴敏, 等. 近30年来广东省土壤pH值的时空变化[J].
应用生态学报, 2011, 22(2): 425–430.
Guo Z X, Wang J, Chai M, et al. Spatiotemporal variation of soil pH in Guangdong Province of China in past 30 years[J]. Chinese Journal of Applied Ecology, 2011, 22(2): 425–430. |
| [8] |
曾招兵, 曾思坚, 刘一锋, 等. 1984年以来广东水稻土pH变化趋势及影响因素[J].
土壤, 2014, (4): 732–736.
Zeng Z B, Zeng S J, Liu Y F, et al. Change tendency of paddy soil pH in Guangdong Province since 1984 and influential factors[J]. Soils, 2014, (4): 732–736. |
| [9] |
邵学新, 黄标, 顾志权, 等. 长三角经济高速发展地区土壤pH时空变化及其影响因素[J].
矿物岩石地球化学通报, 2006, 25(2): 143–149.
Shao X X, Huang B, Gu Z Q, et al. Spatial-temporal variation of pH values of soils in a rapid economic developing area in the Yangtze River delta region and their causing factors[J]. Bulletin of Mineralogy Petrology and Geochemistry, 2006, 25(2): 143–149. |
| [10] |
张永春, 汪吉东, 沈明星, 等. 长期不同施肥对太湖地区典型土壤酸化的影响[J].
土壤学报, 2010, 47(3): 465–472.
Zhang Y C, Wang J D, Shen M X, et al. Effects of long-term fertilization on soil acidification in Taihu Lake region, China[J]. Acta Pedologica Sinica, 2010, 47(3): 465–472. |
| [11] |
周晓阳, 徐明岗, 周世伟, 等. 长期施肥下我国南方典型农田土壤的酸化特征[J].
植物营养与肥料学报, 2015, 21(6): 1615–1621.
Zhou X Y, Xu M G, Zhou S W, et al. Soil acidification characteristics in southern China’s croplands under long-term fertilization[J]. Journal of Plant Nutrition and Fertilizer, 2015, 21(6): 1615–1621. |
| [12] |
孟红旗, 刘景, 徐明岗, 等. 长期施肥下我国典型农田耕层土壤的pH演变[J].
土壤学报, 2013, 50(6): 1109–1116.
Meng H Q, Liu J, Xu M G, et al. Evolution of pH in soils of typical Chinese croplands under long-term fertilization[J]. Acta Pedologica Sinica, 2013, 50(6): 1109–1116. |
| [13] | Barak P, Jobe B O, Krueger A R, et al. Effects of long-term soil acidification due to nitrogen fertilizer inputs in Wisconsin[J]. Plant and Soil, 1997, 197(1): 61–69. DOI:10.1023/A:1004297607070 |
| [14] |
徐仁扣, CoventryD R. 某些农业措施对土壤酸化的影响[J].
农业环境保护, 2002, 21(5): 385–388.
Xu R K, Coventry D R. Soil acidification as influenced by some agricultural practices[J]. Agro-environmental Protection, 2002, 21(5): 385–388. |
| [15] | Covaleda S, Pajares S, Gallardo J F, et al. Effect of different agricultural management systems on chemical fertility in cultivated tepetates of the Mexican transvolcanic belt[J]. Agriculture, Ecosystems & Environment, 2009, 129(4): 422–427. |
| [16] | Zhang H M, Wang B R, Xu M G, et al. Crop yield and soil responses to long-term fertilization on a red soil in Southern China[J]. Pedosphere, 2009, 19(2): 199–207. DOI:10.1016/S1002-0160(09)60109-0 |
| [17] | Malhi S S, Nyborg M, Goddard T, et al. Long-term tillage straw and N rate effects on some chemical properties in two contrasting soil types in Western Canada[J]. Nutrient Cycling in Agroecosystems, 2011, 90(1): 133–146. DOI:10.1007/s10705-010-9417-x |
| [18] | Malhi S S, Nyborg M, Harapiak J T. Effects of long-term N fertilizer-induced acidification and liming on micronutrients in soil and in bromegrass hay[J]. Soil and Tillage Research, 1998, 48(1/2): 91–101. |
| [19] | Schroder J L, Zhang H, Girma K, et al. Soil acidification from long-term use of nitrogen fertilizers on winter wheat[J]. Soil Science Society of America Journal, 2011, 75(3): 957–964. DOI:10.2136/sssaj2010.0187 |
| [20] | McAndrew D W, Malhi S S. Long-term N fertilization of a solonetzic soil: Effects on chemical and biological properties[J]. Soil Biology & Biochemistry, 1992, 24(7): 619–623. |
| [21] |
鲁如坤. 土壤农业化学分析方法[M]. 北京: 中国农业科技出版社, 2000.
Lu R K. Analytical methods for soil and agro-chemistry[M]. Beijing: China Agricultural Science and Technology Press, 2000. |
| [22] |
熊毅, 李庆逵. 中国土壤(第二版)[M]. 北京: 科学出版社, 1990: 433–443.
Xiong Y, Li Q K. The soils of China (2nd edition) [M]. Beijing: Science Press, 1990: 433–443. |
| [23] | Medyńska-Juraszek A. Composition and activity of the microbial communities in forest floor exposed to deposition from copper industry [A]. Conference of ecology of soil microorganisms. Microbes are important drivers of soil processes[C]. Prague, Czech Republic, 2011: 9. |
| [24] | Adams T M, Adams S N. The effects of liming on soil pH and carbon contained in the soil biomass[J]. Journal of Agricultural Science, 1983, 101(3): 553–558. DOI:10.1017/S0021859600038570 |
| [25] | Motavalli P P, Palm C A, Parton W J, et al. Soil pH and organic C dynamics in tropical forest soils: Evidence from laboratory and simulation studies[J]. Soil Biology & Biochemistry, 1995, 27(12): 1589–1599. |
| [26] | Bull I D, Bergen P F V, Poulton P R, et al. Organic geochemical studies of soils from the Rothamsted Classical Experiments-II, Soils from the Hoosfield Spring Barley Experiment treated with different quantities of manure[J]. Organic Geochemistry, 1998, 28(1-2): 11–26. DOI:10.1016/S0146-6380(97)00114-9 |
| [27] | Sylvie D, Claude L. A review of some important families of refractory macromolecules: composition, origin, and fate in soils and sediments[J]. Soil Science, 2001, 166(11): 833–847. DOI:10.1097/00010694-200111000-00008 |
| [28] |
戴万宏, 黄耀, 武丽, 等. 中国地带性土壤有机质含量与酸碱度的关系[J].
土壤学报, 2009, 46(5): 851–860.
Dai W H, Huang Y, Wu L, et al. Relationships between soil organic matter content (SOM) and pH in topsoil of zonal soils in China[J]. Acta Pedologica Sinica, 2009, 46(5): 851–860. |
| [29] | Okuda I, Okazaki M, Hashitani T. Spatial and temporal variations in the chemical weathering of basaltic pyroclastic materials[J]. Soil Science Society of American Journal, 1995, 59: 887–894. DOI:10.2136/sssaj1995.03615995005900030037x |
| [30] |
惠学香. 扬州地区酸雨现状及成因分析[J].
环境监控与预警, 2013, 5(1): 43–46.
Hui X X. Analysis on the situation and cause of the acid rain in Yangzhou area[J]. Environmental Monitoring and Forewarning, 2013, 5(1): 43–46. |
 2017, Vol. 23
  doi:
doi: 
