2. 中海油研究总院有限责任公司, 北京 朝阳 100028
2. CNOOC Research Institute Ltd., Chaoyang, Beijing 100028, China
油水相对渗透率曲线是油藏开发中的重要参数,准确给定油水相对渗透率曲线,有助于对油田开发规律的正确认识。相对渗透率曲线可通过室内实验方法获得,但由于天然岩芯数量有限,实验获得的相对渗透率曲线难以反映整个油藏的实际情况[1-2]。为此,有学者提出了基于油田生产数据来计算相对渗透率曲线的方法[3-9],但目前计算方法中的残余油饱和度端点值通常采用初始相渗实验得到的数值,未能考虑长期水驱引起的油藏残余油饱和度变化[10-13],同时目前方法主要通过多元回归拟合等数学方法,缺乏严谨理论推导,应用有一定的局限性。为此,本文基于新型的近似理论水驱曲线,推导了油相指数、水相指数、残余油饱和度下的水相相对渗透率等相对渗透率曲线关键参数的数学表征公式,同时结合残余油饱和度计算方法,构建了一种广泛适用的考虑储层参数时变效应的油水相对渗透率曲线动态计算方法。
1 理论推导 1.1 近似理论水驱曲线近似理论水驱曲线是基于油水相对渗透率指数表达式直接推导得到的一种新型水驱曲线,通过引入两个可变参数
| $ {N_{\rm{p}}} = {N_{\rm{R}}} - a\dfrac{{N_{\rm{p}}^p}}{{W_{\rm{p}}^q}} $ | (1) |
近似理论水驱曲线4个特征参数
基于近似理论水驱曲线表达式(式(1)),可得水油比具有如下关系
| $ \dfrac{{{f_{\rm{w}}}}}{{1 - {f_{\rm{w}}}}} = \dfrac{{{Q_{\rm{w}}}}}{{{Q_{\rm{o}}}}} = \dfrac{{\partial {W_{\rm{p}}}}}{{\partial {N_{\rm{p}}}}} = \\\quad\quad\quad\quad \dfrac{p}{q}{a^{\frac{1}{q}}}N_{\rm{R}}^{\frac{p}{q} - \frac{1}{q} - 1} \times \dfrac{{\left( {1 + \dfrac{{1 - p}}{p}R} \right)}}{{{{(1 - R)}^{\frac{1}{q} + 1}}}} \times {R^{\frac{p}{q} - 1}} $ | (2) |
其中,
当含水率小于98%时,可忽略分子中的
| $ \dfrac{{{f_{\rm{w}}}}}{{1 - {f_{\rm{w}}}}} = \left( {\dfrac{p}{q}{a^{\frac{1}{q}}}N_{\rm{R}}^{\frac{p}{q} - \frac{1}{q} - 1}} \right) \times \dfrac{{{R^{\frac{p}{q} - 1}}}}{{{{(1 - R)}^{\frac{1}{q} + 1}}}} $ | (3) |
油水两相相对渗透率曲线可采用指数形式表达[1]
| $ {K_{{\rm{rw}}}} = {K_{{\rm{rw}}}}({S_{{\rm{or}}}}){\left( {\dfrac{{{S_{\rm{w}}} - {S_{{\rm{wi}}}}}}{{1 - {S_{{\rm{wi}}}} - {S_{{\rm{or}}}}}}} \right)^{{n_{\rm{w}}}}} $ | (4) |
| $ {K_{{\rm{ro}}}} = {K_{{\rm{ro}}}}({S_{{\rm{wi}}}}){\left( {\dfrac{{1 - {S_{\rm{w}}} - {S_{{\rm{or}}}}}}{{1 - {S_{{\rm{wi}}}} - {S_{{\rm{or}}}}}}} \right)^{{n_{\rm{o}}}}} $ | (5) |
忽略重力和毛管力作用的分流量方程可表示为
| $ {f_{\rm{w}}} = \dfrac{1}{{1 + \dfrac{{{K_{{\rm{ro}}}}}}{{{K_{{\rm{rw}}}}}}\dfrac{{{\mu _{\rm{w}}}}}{{{\mu _{\rm{o}}}}}\dfrac{{{B_{\rm{w}}}}}{{{B_{\rm{o}}}}}}} $ | (6) |
将式(4)、式(5)代入式(6),并转化为可采储量采出程度表达式
| $ \dfrac{{{f_{\rm{w}}}}}{{1 - {f_{\rm{w}}}}} = \dfrac{{{K_{{\rm{rw}}}}}}{{{K_{{\rm{ro}}}}}}\dfrac{{{\mu _{\rm{o}}}{B_{\rm{o}}}}}{{{\mu _{\rm{w}}}{B_{\rm{w}}}}} = M\dfrac{{{R^{{n_{\rm{w}}}}}}}{{{{(1 - R)}^{{n_{\rm{o}}}}}}} $ | (7) |
式(7)中,
| $ M = \dfrac{{{K_{{\rm{rw}}}}({S_{{\rm{or}}}}){\mu _{\rm{o}}}{B_{\rm{o}}}}}{{{K_{{\rm{ro}}}}({S_{{\rm{wi}}}}){\mu _{\rm{w}}}{B_{\rm{w}}}}} $ | (8) |
式(3)和式(7)联立,可得油水相指数与近似理论水驱曲线特征参数
| $ {n_{\rm{w}}} = \dfrac{p}{q} - 1 $ | (9) |
| $ {n_{\rm{o}}} = \dfrac{1}{q} + 1 $ | (10) |
| $ M = \dfrac{p}{q}{a^{\frac{1}{q}}}N_{\rm{R}}^{\frac{p}{q} - \frac{1}{q} - 1} $ | (11) |
由文献[18]可知,极限驱油效率为可动油储量与动用地质储量比值,即
| $ {E_{\rm{D}}} = \dfrac{{{N_{\rm{R}}}}}{N} $ | (12) |
根据极限驱油效率定义公式[19]
| $ {E_{\rm{D}}} = \dfrac{{1 - {S_{{\rm{wi}}}} - {S_{{\rm{or}}}}}}{{1 - {S_{{\rm{wi}}}}}} $ | (13) |
由式(12)、式(13)可得,残余油饱和度为
| $ {S_{{\rm{or}}}} = \left( {1 - \dfrac{{{N_{\rm{R}}}}}{N}} \right)(1 - {S_{{\rm{wi}}}}) $ | (14) |
综上,相对渗透率曲线动态计算方法包括如下步骤:(1)根据生产数据,计算近似理论水驱曲线四个特征参数
西江油田为边底水能量充足的海相砂岩油田,储层孔隙连通性好,孔隙度20.1%
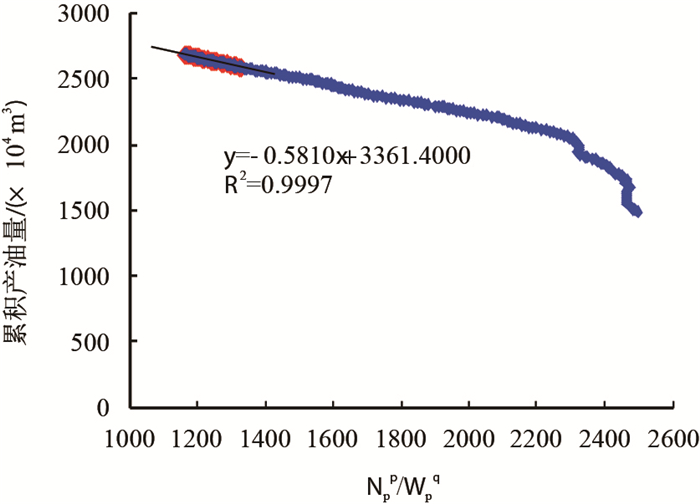
根据油田累产油、累产水等历史生产数据,调节
 |
| 图1 近似理论水驱曲线参数计算 Fig. 1 Calculation of parameters of the approximate theoretical water-drive curve |
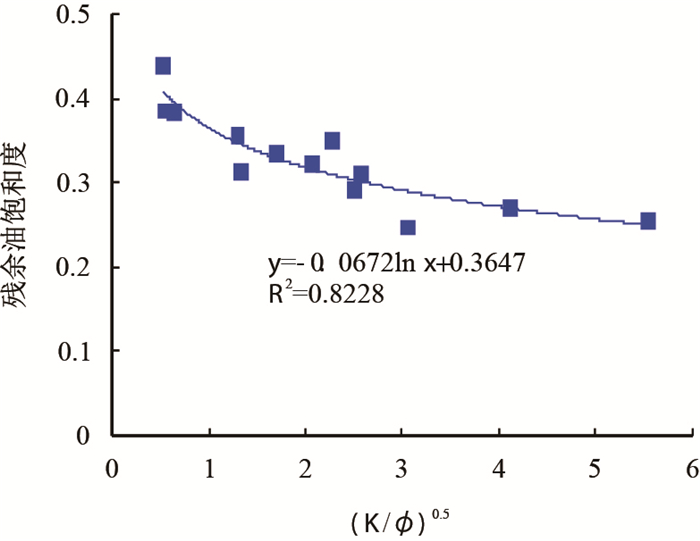
对西江油田评价井15块岩芯做驱替实验,得到初始状态下的残余油饱和度(图 2)。由图 2可知,地质特征参数与残余油饱和度呈现出较好的对数关系,初始状态下油藏的残余油饱和度主要分布在0.25
 |
| 图2 西江油田残余油饱和度随地质特征参数变化关系 Fig. 2 Relationship between residual oil saturation and geological characteristic parameters in X Oilfield |
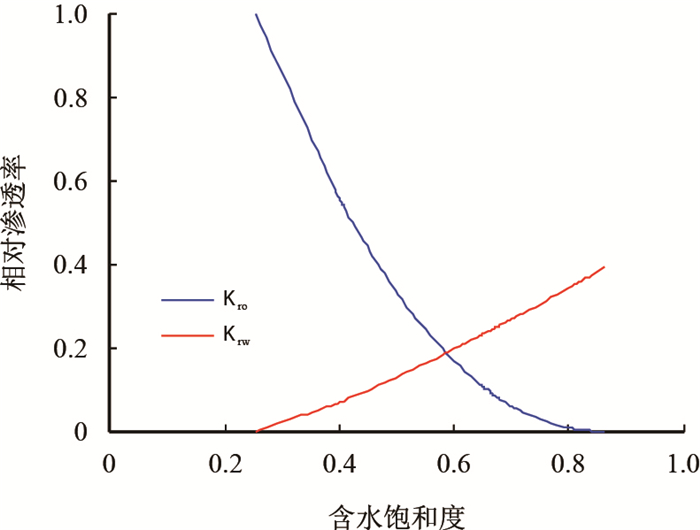
根据近似理论水驱曲线四个特征参数,由式(9)、式(10)和式(11)计算可得
 |
| 图3 理论计算得到的相对渗透率曲线 Fig. 3 The theoretical relative permeability curves |
 |
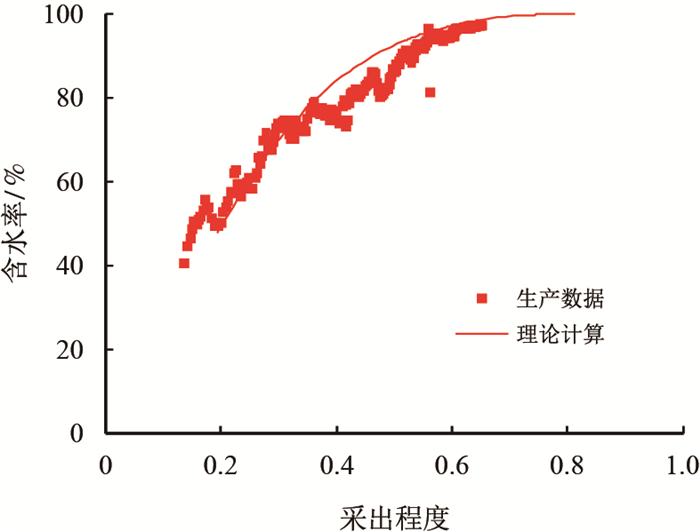
| 图4 理论计算的油水相对渗透率曲线预测油田含水率上升规律 Fig. 4 The oil field rising water-cut predicted by theoretical relative permeability curves |
从图 4可以看出,根据理论相对渗透率曲线所得到的含水率随采出程度的变化关系与实际生产数据吻合,预测油田含水率达到98%时,采出程度可达到66%,西江油田仍有107
(1) 建立了残余油饱和度动态计算方法,可根据生产动态数据计算油藏长期水驱后的残余油饱和度,克服了现有相对渗透率曲线计算方法只能依赖实验测量残余油饱和度端点值的局限性,实现了油藏残余油饱和度的时变表征。
(2) 基于新型的理论水驱曲线建立了油相指数、水相指数、残余油饱和度下的水相相对渗透率等相对渗透率曲线关键参数的数学表征公式,并结合残余油饱和度计算方法提出了一种考虑储层参数时变的水驱油藏相对渗透率曲线计算新方法。
(3) 典型油田应用实例表明,该方法有助于解决长期水驱后油藏相对渗透率曲线有效表征的问题,也可广泛应用于疏松砂岩等取芯困难油田基础参数的获取,从而为油田可采储量标定、剩余油分布规律研究、特高含水期油藏数值模拟历史拟合等提供参考。
符号说明
| [1] |
秦同洛, 李汤玉, 陈元千. 实用油藏工程方法[M]. 北京: 石油工业出版社, 1989. QIN Tongluo, LI Tangyu, CHEN Yuanqian. Practical reservoir engineering method[M]. Beijing: Petroleum Industry Press, 1989. |
| [2] |
何建民. 油水相对渗透率曲线异常影响因素探讨[J]. 油气地质与采收率, 2009, 16(2): 74-76, 80. HE Jianmin. Influencing factors of abnormal oil/water relative permeability curve[J]. Petroleum Geology and Recovery Efficiency, 2009, 16(2): 74-76, 80. doi: 10.3969/j.-issn.1009-9603.2009.02.023 |
| [3] |
杨宇, 周文, 邱坤泰, 等. 计算相对渗透率曲线的新方法[J]. 油气地质与采收率, 2010, 17(2): 105-107. YANG Yu, ZHOU Wen, QIU Kuntai, et al. A new method of calculation relative permeability curve[J]. Petroleum Geology and Recovery Efficiency, 2010, 17(2): 105-107. doi: 10.3969/j.issn.1009-9603.2010.02.030 |
| [4] |
蒋明, 宋富霞, 郭发军, 等. 利用水驱特征曲线计算相对渗透率曲线[J]. 新疆石油地质, 1999, 20(5): 418-421. JIANG Ming, SONG Fuxia, GUO Fajun, et al. Computation of relative permeability curve by using waterdrive curve[J]. Xinjiang Petroleum Geology, 1999, 20(5): 418-421. |
| [5] |
吕新东, 冯文光, 杨宇, 等. 利用动态数据计算相渗曲线的新方法[J]. 特种油气藏, 2009, 16(5): 65-66, 75. LÜ Xindong, FENG Wenguang, YANG Yu, et al. A new method of calculation relative permeability curve with performance data[J]. Special Oil and Gas Reservoirs, 2009, 16(5): 65-66, 75. doi: 10.3969/j.issn.1006-6535.-2009.05.018 |
| [6] |
阎静华, 许寻, 杜永波. 计算相渗曲线的新方法-甲型水驱曲线法[J]. 断块油气田, 2001, 8(1): 38-40. YAN Jinghua, XU Xun, DU Yongbo. A new method of calculation the relative permeability curve:The first water drive characteristic curve[J]. Fault-Block Oil & Gas Field, 2001, 8(1): 38-40. doi: 10.3969/j.issn.1005-8907.-2001.01.013 |
| [7] |
杜殿发, 林新宇, 巴忠臣, 等. 利用甲型水驱特征曲线计算相对渗透率曲线[J]. 特种油气藏, 2013, 20(5): 93-96. DU Dianfa, LIN Xinyu, BA Zhongchen, et al. Calculation of relative permeability curve with Type A characteristic curve of water drive[J]. Special Oil and Gas Reservoirs, 2013, 20(5): 93-96. doi: 10.3969/j.issn.1006-6535.-2013.05.020 |
| [8] |
梁尚斌, 赵海洋, 宋宏伟, 等. 利用生产数据计算油藏相对渗透率曲线方法[J]. 大庆石油地质与开发, 2005, 24(2): 24-25. LIANG Shangbin, ZHAO Haiyang, SONG Hongwei, et al. Method of calculating relative permeability curve by production data[J]. Petroleum Geology & Oilfield Development in Daqing, 2005, 24(2): 24-25. doi: 10.3969/j.issn.-1000-3754.2005.02.008 |
| [9] |
王怒涛, 陈浩, 王陶, 等. 用生产数据计算油藏相对渗透率曲线[J]. 西南石油学院学报, 2005, 27(5): 26-28. WANG Nutao, CHEN Hao, WANG Tao, et al. Calculation method of relative permeability curve from production data[J]. Journal of Southwest Petroleum Institute, 2005, 27(5): 26-28. doi: 10.3863/j.issn.1674-5086.2005.05.007 |
| [10] |
刘显太. 中高渗透砂岩油藏储层物性时变数值模拟技术[J]. 油气地质与采收率, 2011, 18(5): 58-62. LIU Xiantai. Study on numerical simulation technology based on time varying physical properties in min-high permeability sandstone reservoirs[J]. Petroleum Geology and Recovery Efficiency, 2011, 18(5): 58-62. doi: 10.3969/j.-issn.1009-9603.2011.05.016 |
| [11] |
崔传智, 耿正玲, 王延忠, 等. 水驱油藏高含水期渗透率的动态分布计算模型及应用[J]. 中国石油大学学报(自然科学版), 2012, 36(4): 118-122. CUI Chuanzhi, GENG Zhengling, WANG Yanzhong, et al. Calculation model of dynamic permeability distribution and its application to water drive reservoir at high water cut stage[J]. Journal of China University of Petroleum, 2012, 36(4): 118-122. doi: 10.3969/j.issn.1673-5005.2012.04.022 |
| [12] |
陈丹磬, 李金宜, 朱文森, 等. 海上疏松砂岩稠油油藏水驱后储层参数变化规律实验[J]. 中国海上油气, 2016, 28(5): 54-60. CHEN Danqing, LI Jinyi, ZHU Wensen, et al. Experimental research on reservoir parameters variation after water flooding for offshore unconsolidated sandstone heavy oil reservoirs[J]. China Offshore Oil and Gas, 2016, 28(5): 54-60. doi: 10.11935/j.issn.1673-1506.2016.05.009 |
| [13] |
文馨, 戴宗, 王华, 等. 海相砂岩油藏长期水驱后储层物性变化规律[J]. 特种油气藏, 2017, 24(1): 157-161. WEN Xin, DAI Zong, WANG Hua, et al. Physical properties of marine sandstone reservoir after long-term waterflooding[J]. Special Oil and Gas Reservoirs, 2017, 24(1): 157-161. doi: 10.3969/j.issn.1006-6535.2017.01.032 |
| [14] |
张金庆. 水驱油田产量预测模型[M]. 北京: 石油工业出版社, 2012. ZHANG Jinqing. The prediction model of oilfield production water flooding[M]. Beijing: Petroleum Industry Press, 2012. |
| [15] |
王小林, 于立君, 唐玮, 等. 特高含水期含水率与采出程度关系式[J]. 特种油气藏, 2015, 22(5): 104-106. WANG Xiaolin, YU Lijun, TANG Wei, et al. Relationship between water-cut and recovery degree in ultrahigh water-cut stage[J]. Special Oil and Gas Reservoirs, 2015, 22(5): 104-106. doi: 10.3969/j.issn.1006-6535.-2015.05.022 |
| [16] |
宋兆杰, 李治平, 赖枫鹏, 等. 高含水期油田水驱特征曲线关系式的理论推导[J]. 石油勘探与开发, 2013, 40(2): 201-208. SONG Zhaojie, LI Zhiping, LAI Fengpeng, et al. Derivation of water flooding characteristic curve for high watercut oilfields[J]. Petroleum Exploration and Development, 2013, 40(2): 201-208. doi: 10.11698/PED.2013.02.09 |
| [17] |
孙红霞. 高含水期水驱特征曲线上翘新认识[J]. 特种油气藏, 2016, 23(1): 92-95. SUN Hongxia. New understanding of upward waterflooding characteristic curve in high water-cut stage[J]. Special Oil and Gas Reservoirs, 2016, 23(1): 92-95. doi: 10.-3969/j.issn.1006-6535.2016.01.020 |
| [18] |
陈元千, 王惠芝. 丙型水驱曲线的扩展推导及其在埕北油田的应用[J]. 中国海上油气, 2004, 16(6): 392-394. CHEN Yuanqian, WANG Huizhi. An extended derivation of type C water drive curve and its application in Chengbei Oilfield[J]. China Offshore Oil and Gas, 2004, 16(6): 392-394. doi: 10.3969/j.issn.1673-1506.2004.06.008 |
| [19] |
俞启泰, 赵明, 林志芳. 水驱砂岩油田驱油效率和波及系数研究(一)[J]. 石油勘探与开发, 1989, 1(2): 48-52. YU Qitai, ZHAO Ming, LIN Zhifang. A study of the displacement efficiency and the conformance factor in waterflooded sandstone reservoirs in China[J]. Petroleum Exploration and Development, 1989, 1(2): 48-52. |
| [20] |
闫正和, 罗东红, 许庆华. 南海东部海域油田开发模式的创新与应用实践[J]. 中国海上油气, 2014, 26(3): 72-77. YAN Zhenghe, LUO Donghong, XU Qinghua. The innovation and application of the development models for the offshore oil fields in the eastern South China Sea[J]. China Offshore Oil and Gas, 2014, 26(3): 72-77. |
| [21] |
刘晨, 张金庆, 周文胜, 等. 海上高含水油田群液量优化模型的建立及应用[J]. 中国海上油气, 2016, 28(6): 46-52. LIU Chen, ZHANG Jinqing, ZHOU Wensheng, et al. Modeling of liquid production optimization in high water cut offshore oilfield group and its application[J]. China Offshore Oil and Gas, 2016, 28(6): 46-52. doi: 10.-11935/j.issn.1673-1506.2016.06.008 |
| [22] |
肖康, 穆龙新, 姜汉桥, 等. 水驱优势通道下微观潜力分布及改变流线挖潜[J]. 西南石油大学学报(自然科学版), 2014, 26(5): 92-100. XIAO Kang, MU Longxin, JIANG Hanqiao, et al. Microscopic distribution of potentially recoverable oil during the waterflooding of preferential petroleum migration pathways and echanced oil recovery through streamline alteration[J]. Journal of Southwest Petroleum University (Science & Technology Edition), 2014, 26(3): 72-77. doi: 10.11885/j.issn.1674-5086.2015.08.28.01 |
| [23] |
洪楚侨, 王雯娟, 鲁瑞斌, 等. 强水驱油藏渗透率动态变化规律定量预测方法[J]. 西南石油大学学报(自然科学版), 2018, 40(5): 113-121. HONG Chuqiao, WANG Wenjuan, LU Ruibin, et al. A quantitative method to predict the dynamic variation in permeability of oil reservoirs during waterflooding and oil displacement[J]. Journal of Southwest Petroleum University (Science & Technology Edition), 2018, 40(5): 113-121. doi: 10.11885/j.issn.1674-5086.2017.10.09.01 |
| [24] |
宋睿, 汪尧, 刘建军. 岩石孔隙结构表征与流体输运可视化研究进展[J]. 西南石油大学学报(自然科学版), 2018, 40(6): 85-105. SONG Rui, WANG Yao, LIU Jianjun. Microscopic pore structure characterization and fluids transport visualization of reservoir rock[J]. Journal of Southwest Petroleum University (Science & Technology Edition), 2018, 40(6): 85-105. doi: 10.11885/j.issn.1674-5086.2018.07.18.03 |
| [25] |
宁宁, 李怡超, 刘洪林, 等. 不同渗透率岩芯孔径分布与可动流体研究[J]. 西南石油大学学报(自然科学版), 2018, 40(2): 91-97. NING Ning, LI Yichao, LIU Honglin, et al. Study on influence of permeability and distribution of pore diameters in rock cores on measurement of mobile fluid saturation[J]. Journal of Southwest Petroleum University (Science & Technology Edition), 2018, 40(2): 91-97. doi: 10.11885/j.-issn.1674-5086.2016.04.25.01 |
 2019, Vol. 41


