2. 西南石油大学理学院, 四川 成都 610500;
3. 四川建筑职业技术学院经济管理系, 四川 德阳 618000
2. School of Science, Southwest Petroleum University, Chengdu, Sichuan 610500, China;
3. Economic Management Department of Sichuan College of Architectural Technology, Deyang, Sichuan 618000, China
油田开发面临许多问题,进入高含水甚至特高含水开发阶段,油、水相对渗透率比与含水饱和度关系曲线在半对数坐标轴上不再呈线性特征[1-2],基于线性规律得出的油藏工程方法无法准确描述高含水或特高含水渗流特征[3-10],如基于线性相渗表征的水驱特征曲线方程[11-16]。以往关于相渗曲线的研究与应用大多停留在线性表征[17-21]、修正指数表征[22]、多项式表征[8]等方面。虽然修正的指数标准能大致反映特高含水期半对数非线性特征,但预测精度不高;多项式表征相对于传统的线性表征方法极大提高了预测精度,但难以反映相渗半对数非线性特征。因而需要建立拟合精度高又能反映半对数数轴上相渗曲线末端弯曲特性的表征方法,指导特高含水期油藏开发实践。
通过对比前人研究成果,分析特高含水开发阶段相渗特征,本文重点研究了油水相对渗透率比与含水饱和度在半对数坐标的直线偏移特征,率先引入有理函数拟合方法到相渗表征中,采用局部加权线性平滑回归分析及概率
(1) 随含水饱和度的增加,油相相对渗透率下降趋缓,水相相对渗透率大幅增加,并且水相增加的倍数远大于油相降低的幅度。胜利油田ST2-0斜检313井257号岩样的油水相对渗透率分析表明,含水率98%时油相相对渗透率值是含水率90%时油相相对渗透率值的1/3,含水率98%时水相相对渗透率值是含水率90%时油相相对渗透率值的12倍。
(2) 油水两相相对渗透率比值
(3) 普遍认为,当油田含水率超过50%之后,不同的方法应用到相渗半对数曲线中都能出现直线段[17]。进入特高含水期以后,油水相对渗透率比
结合有理多项式函数区间内连续可导及末端弯曲特性,构造有理多项式函数
| $ y = \dfrac{{{p_{\rm{1}}}{x^n}{\rm{ + }}{p_{\rm{2}}}{x^{n - 1}}{\rm{ + }} \cdots {p_n}x{\rm{ + }}{p_{n + 1}}}}{{{x^m}{\rm{ + }}{q_{\rm{1}}}{x^{m - 1}}{\rm{ + }} \cdots {\rm{ + }}{q_{m - 1}}x{\rm{ + }}{q_m}}} $ | (1) |
结合特高含水期相渗特征,构造适合于特高含水期相渗特征的有理多项式函数
| $ y{\rm{ = ln}}\dfrac{{{K_{{\rm{ro}}}}}}{{{K_{{\rm{rw}}}}}}{\rm{ = }}\dfrac{{{p_1}S_{\rm{w}}^n + {p_2}S_{\rm{w}}^{n - 1} + \cdots + {p_n}{S_{\rm{w}}} + {p_{n + 1}}}}{{S_{\rm{w}}^m + {q_1}S_{\rm{w}}^{m - 1} + \cdots + {q_{m - 1}}{S_{\rm{w}}} + {q_m}}} $ | (2) |
半对数坐标轴曲线特征分析:当
该表达式能实现高相关性,高精度拟合。当
构造局部加权误差模型[23]
| $ \min E({p_1}, {p_2}, \cdots , {p_{n + 1}}, {q_1}, {q_2}, \cdots , {q_m}) = \\\quad\quad\quad\quad \sum\limits_{i = 1}^n {\left\{ {{{\left\{ {{y_i} - {{\left[ {y\left( {{S_{\rm{w}}}} \right)} \right]}_i}} \right\}}^2}{K_{\rm{h}}}\left[ {{{\left( {{S_{\rm{w}}}} \right)}_i} - {S_{\rm{0}}}} \right]} \right\}} $ | (3) |
其中:
| $ {K_{\rm{h}}}\left[ {{{\left( {{S_{\rm{w}}}} \right)}_i} - {S_0}} \right] = \dfrac{1}{{h\sqrt {2\mathsf{π} } }}{{\rm{e}}^{ - {{\left[ {\dfrac{{{{\left( {{S_{\rm{w}}}} \right)}_i} - {S_0}}}{h}} \right]}^2}}} $ | (4) |
利用数理统计中局部加权平滑估计,开展参数识别[24]确定
| $ \mathop {\mathit{\boldsymbol{\beta}}} \limits^ \wedge = {\left[ {{{\left( {\mathop {{{\mathit{\boldsymbol{S}}}_{\rm{w}}}}\limits^ \wedge } \right)}^{\rm T}}W\mathop {{{\mathit{\boldsymbol{S}}}_{\rm{w}}}}\limits^ \wedge } \right]^{ - 1}}{\left( {\mathop {{{\mathit{\boldsymbol{S}}}_{\rm{w}}}}\limits^ \wedge } \right)^{\rm T}}Wy $ | (5) |
构造统计量
| $ F = \dfrac{{S_{\rm{SE}}/k}}{{R_{\rm{SS}}/(n_0 - k - 1)}} $ | (6) |
给定显著水平
从而确定参数
| $ F_1=\left[ { - {F_\alpha }(k, n_0 - k - 1), {F_{\rm{ \mathsf{ α} }}}(k, n_0 - k - 1)} \right] $ | (7) |
式中:
当
| $ \ln {\dfrac{{{K_{{\rm{ro}}}}}}{{{K_{{\rm{rw}}}}}}} = \dfrac{{{p_1}{S_{\rm{w}}} + {p_2}}}{{{q_0}}} $ | (8) |
当
| $ y{\rm{ = ln}}\dfrac{{{K_{{\rm{ro}}}}}}{{{K_{{\rm{rw}}}}}}{\rm{ = }}\dfrac{{{p_1}S_{\rm{w}}^2 + {p_2}{S_{\rm{w}}} + {p_3}}}{{{q_0}}} $ | (9) |
不同的行业应用背景,所需的有理拟合函数
| $ m = n = 5, h = 0.25\sim0.35 $ | (10) |
能实现99.9%以上相关,且拟合数据与真实数据标准误差低于1%,显著水平为100%的置信区间长度更大。对于涉及积分变化的油藏工程方法改进时,令
选取大庆贝尔油田某区块8块岩芯、榆树林油田东14区块5块岩芯,应用平均相对渗透率方法归一化处理数据、长庆西峰油田庄19井区岩芯数据及羊二庄油田某区块数据[8, 25-26],基础数据见表 1。
| 表1 不同油田区块岩芯油、水相渗数据 Tab. 1 Oil and water permeability data of different oilfield blocks |
图 1表明:贝尔油田某区块、榆树林油田东14区块、西峰油田庄19井区及羊二庄油田某区块进入高含水期后,半对数相渗比与饱和度曲线出现明显的下弯段。
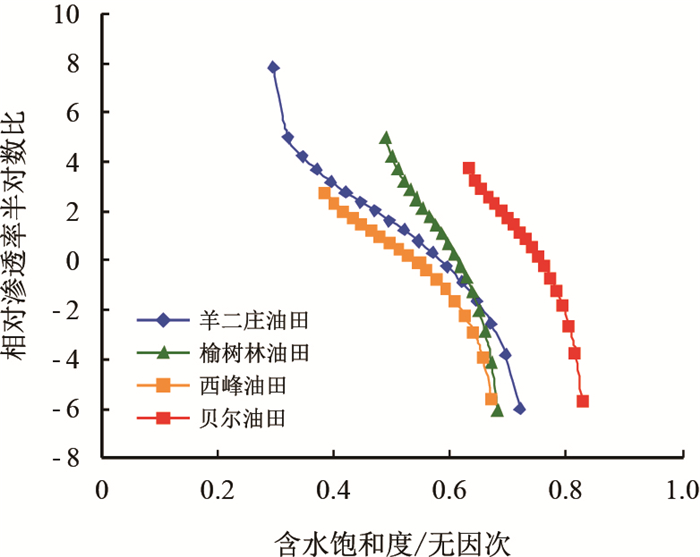 |
| 图1 不同油田区块高含水期相渗数据图 Fig. 1 Relative permeability data figure of different oil field blocks in high water cut stage |
传统的相渗表征方法
| $ \ln {\dfrac{{{K_{{\rm{ro}}}}}}{{{K_{{\rm{rw}}}}}}} = a - b{S_{\rm{w}}} $ | (11) |
基于数据变形处理的线性表征方法[8]
| $ \lg {\dfrac{{{K_{{\rm{ro}}}}}}{{{K_{{\rm{rw}}}}}}} {\rm{ = }}\lg m{\rm{ - }}n{\rm{lg(}}1 - {S_{\rm{w}}}{\rm{)}} $ | (12) |
基于多项式拟合的相渗表征方法[9]
| $ {\rm{ln}}\dfrac{{{K_{{\rm{ro}}}}}}{{{K_{{\rm{rw}}}}}} = aS_{\rm{w}}^2 + b{S_{\rm{w}}} + c $ | (13) |
基于指数模拟的相渗表征方法[21]
| $ {\rm{ln}}\dfrac{{{K_{{\rm{ro}}}}}}{{{K_{{\rm{rw}}}}}}{\rm{ = }}a + bS_{\rm{w}}^2 + c\ln (1 - {S_{\rm{w}}}) $ | (14) |
新方法
| $ {\rm{ln}}\dfrac{{{K_{{\rm{ro}}}}}}{{{K_{{\rm{rw}}}}}} = \dfrac{{{p_1}S_{\rm{w}}^5 + {p_2}S_{\rm{w}}^4 + {p_3}S_{\rm{w}}^3 + {p_4}S_{\rm{w}}^2 + {p_5}{S_{\rm{w}}} + {p_6}}}{{S_{\rm{w}}^5 + {q_1}S_{\rm{w}}^4 + {q_2}S_{\rm{w}}^3 + {q_3}S_{\rm{w}}^2 + {q_4}{S_{\rm{w}}} + {q_5}}} $ | (15) |
选取传统的线性拟合方法、多项式拟合方法与有理拟合新方法进行比较,应用表 1数据开展数值拟合,结果见表 2,图 2,图 3,图 4。
| 表2 传统线性拟合、二项式拟合及有理拟合结果对比分析 Tab. 2 Results comparative analysis of traditional linear fitting, binomial fitting and rational fitting method |
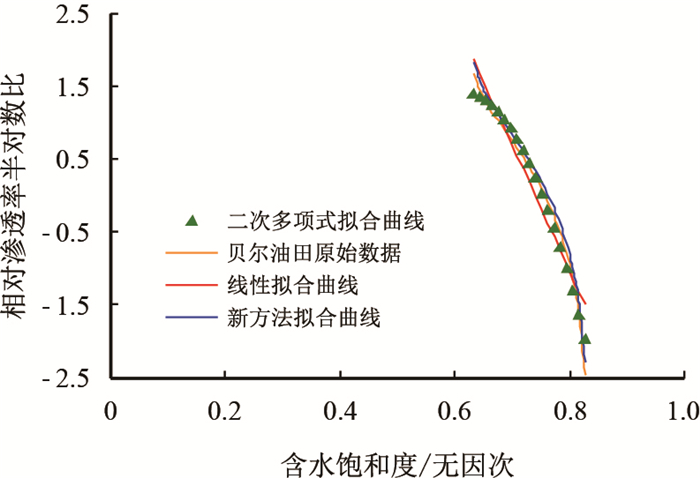 |
| 图2 3种同类方法拟合分析图(贝尔油田) Fig. 2 Fitting analysis with three similar methods of Beier Oilfield |
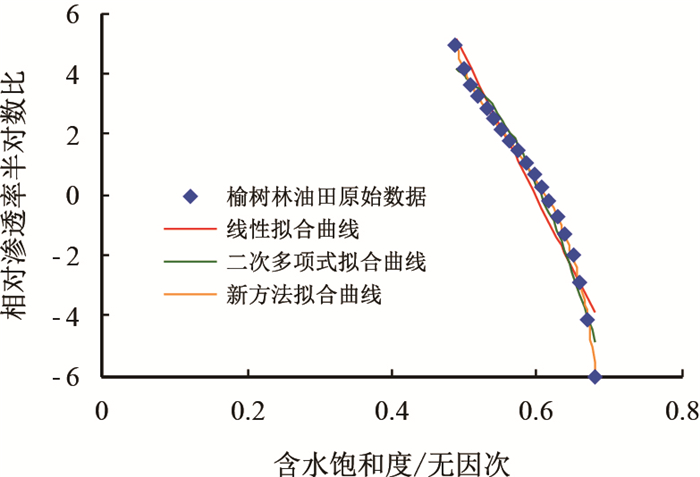 |
| 图3 3种同类方法拟合分析图(榆树林油田) Fig. 3 Fitting analysis with three similar methods of Yushulin Oilfield |
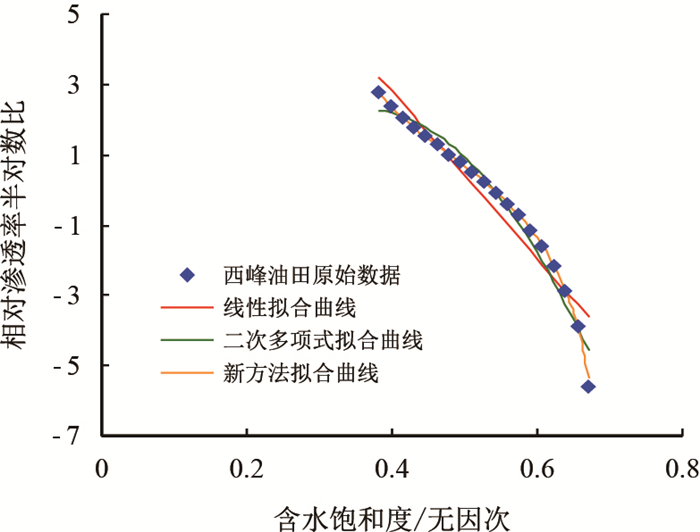 |
| 图4 3种同类方法拟合分析图(西峰油田) Fig. 4 Fitting analysis with three similar methods of Xifeng Oilfield |
由表 2知:新方法较传统方法及多项式拟合法,在参数显著水平99.9%的置信区间长度更大,相关系数全部趋近于1,且残差平方和
由图 2,图 3,图 4知:新方法具有更好的稳定性和高拟合特性,且更好地反映了特高含水期相渗上下端弯曲特性。
选取基于数据变形处理的线性拟合方法、指数拟合方法与有理拟合新方法比较,应用表 1数据开展数值拟合,结果见表 3。
| 表3 指数拟合、基于数据变形处理的线性拟合与有理拟合对比分析 Tab. 3 Results comparative analysis of exponential fitting, Linear fitting based on data deformation and rational fitting method |
由表 3知:新方法较指数拟合方法及基于数据变形处理的线性拟合方法,相关性更强,拟合标准差远小于其他方法,说明新方法在预测油水相渗特征更佳。
由表 3及图 5、图 6、图 7知:虽然指数预测方法能一定程度反映特高含水期相渗弯曲特征,且带修正线性拟合方法预测精度较传统方法高,但新方法比指数预测、带修正的(基于数据变形处理的)线性拟合方法更稳定,预测精度更高,且更能反映特高含水期油水相渗曲线半对数坐标下曲线下翘特性。
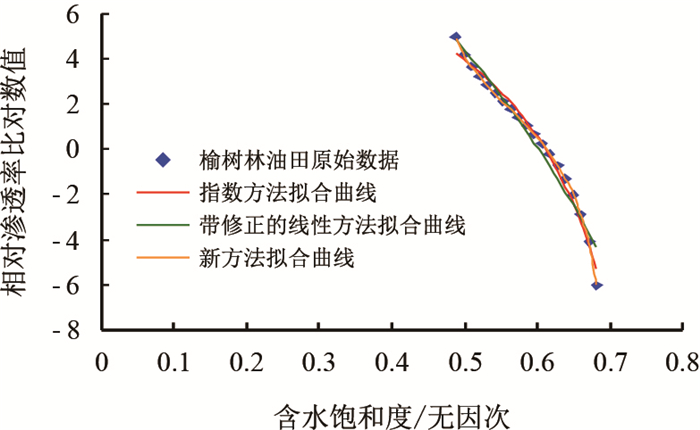 |
| 图5 3种不同方法拟合分析图(榆树林油田东14区块) Fig. 5 Fitting analysis with three different methods of 14 block of Yushulin Oilfield |
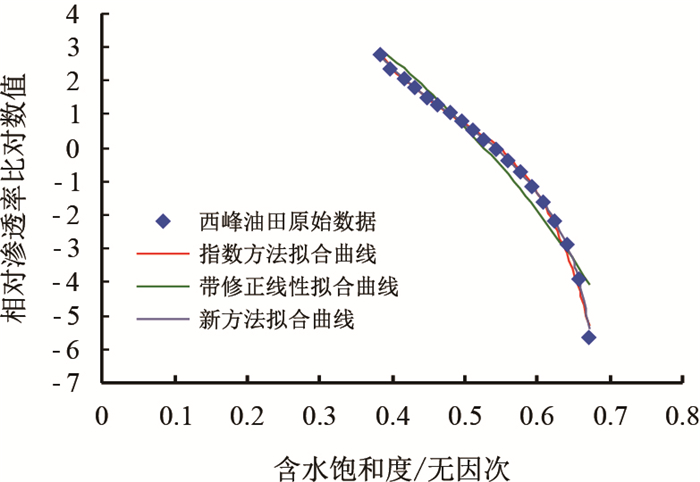 |
| 图6 3种不同方法拟合分析图 Fig. 6 Fitting analysis with three different methods of 19# block of Xifeng Oilfield |
 |
| 图7 3种不同方法拟合分析图(羊二庄油田某区块) Fig. 7 Fitting analysis with three different methods of Yangerzhuang Oilfield block |
根据达西定律,当油水两相同时流过油藏内某一地层的横截面时,水相占整个产液量的百分数称为水的分流量或含水百分数,用
| $ {f_{\rm{w}}} = \dfrac{1}{{1 + \dfrac{{{K_{{\rm{ro}}}}}}{{{K_{{\rm{rw}}}}}}\dfrac{{{\mu _{\rm{w}}}}}{{{\mu _{\rm{o}}}}}}} $ | (16) |
将式(2)代入式(16),得基于有理多项式的含水率计算新方法
| $ {f_{\rm{w}}}\!=\!\dfrac{1}{{1\!+\!\dfrac{{{\mu _{\rm{w}}}}}{{{\mu _{\rm{o}}}}}{{\rm{exp}}{\dfrac{{{p_1}{S_{\rm{w}}}^n\!+\! {p_2}{S_{\rm{w}}}^{n\!-\!1}\!+\! \cdots \!+\!{p_n}{S_{\rm{w}}}\!+\!{p_{n\!+\! 1}}}}{{{S_{\rm{w}}}^m\!+\!{q_1}{S_{\rm{w}}}^{m\!-\!1}\!+\!\cdots \!+\!{q_{m\!-\!1}}{S_{\rm{w}}}\!+\!{q_m}}}}}}} $ | (17) |
以榆树林油田东14区块数据为例,绘制含水率计算图(取
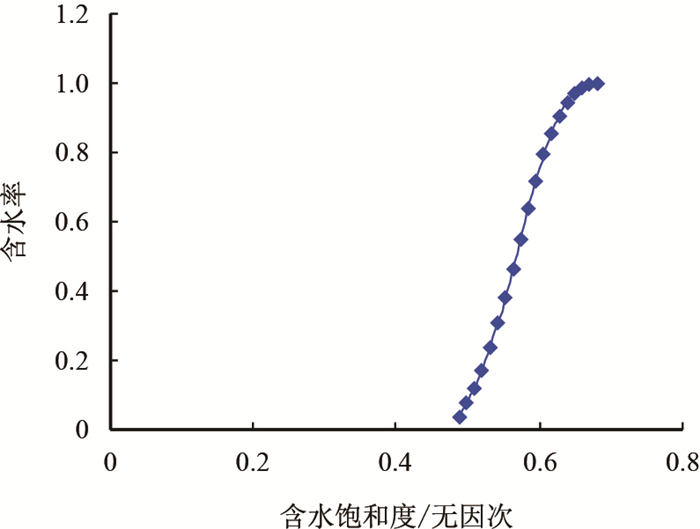 |
| 图8 榆树林油田东14区块含水率曲线 Fig. 8 Water cut curve of 14 block of Yushulin Oil Field |
根据定义[22],无因次采液指数公式为
| $ \overline {{J_{\rm{L}}}} {\rm{ = }}\dfrac{{\overline {{J_{\rm{o}}}} }}{{1 - {f_{\rm{w}}}}} $ | (18) |
将式(2)代入式(18),得改进无因次采液指数计算方法
| $ \overline {{J_{\rm{L}}}}\!\!=\!\!\dfrac{{\overline {{J_{\rm{o}}}} }}{{1\!-\!\dfrac{1}{{1\!\!+\!\!\dfrac{{{\mu _{\rm{w}}}}}{{{\mu _{\rm{o}}}}}{{\rm{exp}}{\dfrac{{{p_1}{S_{\rm{w}}}^n\!\!+\!\! {p_2}{S_{\rm{w}}}^{n\!-\!1}\!+\! \cdots \!\!+\!\!{p_n}{S_{\rm{w}}}\!+\!{p_{n\!+\! 1}}}}{{{S_{\rm{w}}}^m\!+\!{q_1}{S_{\rm{w}}}^{m\!-\!1}\!+\! \cdots \!+\!{q_{m\!-\! 1}}{S_{\rm{w}}}\!+\!{q_m}}}}}}}}} $ | (19) |
根据定义[22],含水上升率公式为
| $ \dfrac{{{\rm{d}}{f_{\rm{w}}}}}{{{\rm{d}}R}} = \dfrac{{b\left( {{f_{\rm{w}}} - {f_{\rm{w}}}^2} \right)}}{{{E_{\rm{v}}}}}(1 - {S_{{\rm{wi}}}}) $ | (20) |
将式(2)代入式(20),得改进无因次采液指数计算方法
| $ \dfrac{{{\rm{d}}{f_{\rm{w}}}}}{{{\rm{d}}R}} = \dfrac{{b(1 - {S_{{\rm{wi}}}})\left( {1 - \dfrac{1}{{1 + \dfrac{{{\mu _{\rm{w}}}}}{{{\mu _{\rm{o}}}}}{{\rm{exp}}{\dfrac{{{p_1}{S_{\rm{w}}}^n + {p_2}{S_{\rm{w}}}^{n - 1} + \cdots + {p_n}{S_{\rm{w}}} + {p_{n + 1}}}}{{{S_{\rm{w}}}^m + {q_1}{S_{\rm{w}}}^{m - 1} + \cdots + {q_{m - 1}}{S_{\rm{w}}} + {q_m}}}}}}}} \right)}}{{{E_{\rm{v}}}\left( {1 + \dfrac{{{\mu _{\rm{w}}}}}{{{\mu _{\rm{o}}}}}{{\rm{exp}}{\dfrac{{{p_1}{S_{\rm{w}}}^n + {p_2}{S_{\rm{w}}}^{n - 1} + \cdots + {p_n}{S_{\rm{w}}} + {p_{n + 1}}}}{{{S_{\rm{w}}}^m + {q_1}{S_{\rm{w}}}^{m - 1} + \cdots + {q_{m - 1}}{S_{\rm{w}}} + {q_m}}}}}} \right)}} $ | (21) |
此处取:
根据稳定渗流条件下水油比定义,知
| $ W_{\rm{OR}} = \dfrac{{{Q_{\rm{w}}}}}{{{Q_{\rm{o}}}}} = \dfrac{{{\mu _{\rm{o}}}{B_{\rm{o}}}{\gamma _{\rm{w}}}}}{{{\mu _{\rm{w}}}{B_{\rm{w}}}{\gamma _{\rm{o}}}}}\dfrac{{{K_{{\rm{rw}}}}}}{{{K_{{\rm{ro}}}}}} $ | (22) |
将式(2)代入式(22),得
| $ W_{\rm{OR}} = \dfrac{{{\mu _{\rm{o}}}{B_{\rm{o}}}{\gamma _{\rm{w}}}}}{{{\mu _{\rm{w}}}{B_{\rm{w}}}{\gamma _{\rm{o}}}}}{{\rm{exp}}{{\dfrac{{{p_1}{S_{\rm{w}}}^n + {p_2}{S_{\rm{w}}}^{n - 1} + \cdots + {p_n}{S_{\rm{w}}} + {p_{n + 1}}}}{{{S_{\rm{w}}}^m + {q_1}{S_{\rm{w}}}^{m - 1} + \cdots + {q_{m - 1}}{S_{\rm{w}}} + {q_m}}}}}} $ | (23) |
选取
| $ \lg W_{\rm{OR}} = \dfrac{{{p_1}}}{2}{S_{\rm{w}}}^2 + \dfrac{{{p_2}}}{2}{S_{\rm{w}}} + {{p_3} + \lg \dfrac{{{\mu _{\rm{o}}}{B_{\rm{o}}}{\gamma _{\rm{w}}}}}{{{\mu _{\rm{w}}}{B_{\rm{w}}}{\gamma _{\rm{o}}}}}} $ | (24) |
由于
| $ {S_{\rm{w}}} = \dfrac{{{N_{\rm{p}}}}}{{{N_{{\rm{om}}}}}} $ | (25) |
结合有理函数的性质,将式(25)代入式(24),化简,得
| $ \lg W_{\rm{OR}} = {u_1}{N_{\rm{p}}}^2 + {u_2}{N_{\rm{p}}} + {u_3} $ | (26) |
其中:
方程式(26)即为基于有理结构的乙型水驱特征曲线方程。
同理,由于含水率满足方程
| $ {f_{\rm{w}}} = \dfrac{{{Q_{\rm{w}}}}}{{{Q_{\rm{w}}} + {Q_{\rm{o}}}}} $ | (27) |
结合式(26)和式(27),得
| $ \ln \dfrac{{{f_{\rm{w}}}}}{{1 - {f_{\rm{w}}}}} = {u_1}{N_{\rm{p}}}^2 + {u_2}{N_{\rm{p}}} + {u_3} $ | (28) |
对于式(26)及式(28)结合本文第二部分所提局部平滑估计法可以很容易拟合相关参数,且拟合精度高,残差平方和小,置信区间长度大。
以羊二庄油田实际数据为例[22],对比分析传统的乙型水驱特征曲线、基于数据变形的水驱特征曲线及新型水驱特征曲线,拟合结果见图 9。
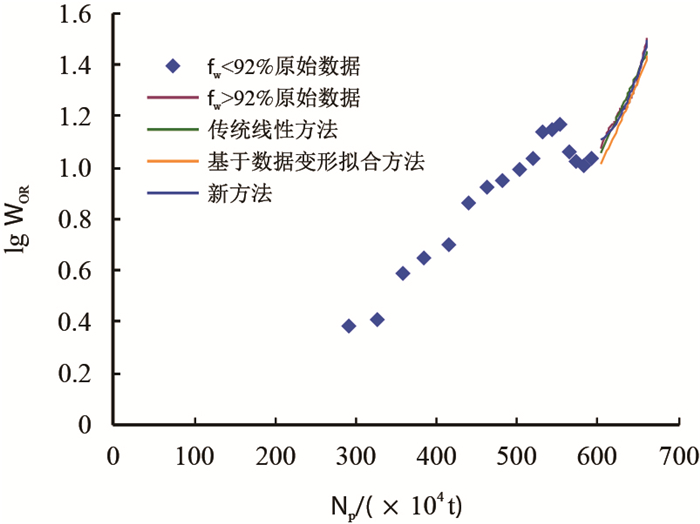 |
| 图9 利用不同方法拟合乙型水驱特征曲线 Fig. 9 Fitting of water cut characteristic curve with different methods |
图 9拟合结果表明:新方法较传统方法及基于数据变化的拟合方法预测精度更高,相关性更强。应用乙型水驱特征曲线拟合含水率92.3%
表达式为
| $ \lg W_{\rm{OR}} = 65.44{N_{\rm{p}}}^2 - 85.29{N_{\rm{p}}} + 28.88 $ | (29) |
基于有理结构的相渗方差改进新型水驱特征曲线,预测精度更高,且能适用于全局拟合及变化幅度大的数据拟合,可以采用新型水驱特征曲线预测可采储量和最终采收率。
5 结论(1) 特高含水期相渗半对数关系不再呈线性,而是明显的上、下弯曲特征。
(2) 传统的线性拟合方法难以适应高含水及特高含水相渗标准拟合。
(3) 传统的线性方法、多项式拟合方法、指数拟合方法及基于数据变形的线性拟合方法,相关性均低于有理拟合新方法,残差平方和均普遍高于新方法,适应性及预测精度均低于新拟合方法。
(4) 五次有理多项式拟合能稳定实现不同特高含水期油田(贝尔、榆树林、西峰、羊二庄)相渗表征100%相关拟合,预测精度达99.9%以上,在参数显著水平99.9%的置信区间长度较其他方法更大,同时还能动态反应末端弯曲特性。
(5) 新方法能发展和完善(特)高含水期水驱评价工程方法:含水率、无因此采液指数、含水上升率、驱油效率、水驱特征曲线等。
符号说明
| [1] |
陈元千, 陶自强. 高含水期水驱曲线的推导及上翘问题的分析[J]. 断块油气田, 1997, 4(3): 19-24. CHEN Yuanqian, TAO Ziqiang. Derivation of water drive curve at high water-cut stage and its analysis of upwarding problem[J]. Fault-Block Oil & Gas Field, 1997, 4(3): 19-24. |
| [2] |
高丽, 宋考平, 马春华, 等. 二段直线法预测高含水期油田开发指标[J]. 石油钻探技术, 2008, 36(5): 72-74. GAO Li, SONG Kaoping, MA Chunhua, et al. Two straight lines to forecast development index of high water-cut oilfield[J]. Petroleum Drilling Techniques, 2008, 36(5): 72-74. doi: 10.3969/j.issn.1001-0890.2008.05.019 |
| [3] |
陈元千. 水驱曲线关系式的推导[J]. 石油学报, 1985, 6(2): 69-78. CHEN Yuanqian. Derivation of relationships of water drive curves[J]. Acta Petrolei Sinica, 1985, 6(2): 69-78. |
| [4] |
俞启泰. 几种重要水驱特征曲线的油水渗流特征[J]. 石油学报, 1999, 20(1): 56-60. YU Qitai. Characteristics of oil-water seepage flow for several important water drive curves[J]. Acta Petrolei Sinica, 1999, 20(1): 56-60. doi: 10.3321/j.issn:0253-2697.1999.01.011 |
| [5] |
陈元千. 油田可采储量计算方法[J]. 新疆石油地质, 2000, 21(2): 130-137. CHEN Yuanqian. Calculation methods of recoverable reserves of oilfields[J]. Xinjiang Petroleum Geology, 2000, 21(2): 130-137. doi: 10.3969/j.issn.1001-3873.-2000.02.011 |
| [6] |
王怒涛, 罗志锋, 黄炳光, 等. 新型水驱特征曲线系列(Ⅱ)[J]. 西南石油大学学报(自然科学版), 2008, 30(1): 106-108. WANG Nutao, LUO Zhifeng, HUANG Bingguang, et al. New type water drive characteristic curve series (Ⅱ)[J]. Journal of Southwest Petroleum University (Science & Technology Edition), 2008, 30(1): 106-108. doi: 10.3863/j.-issn.1000-2634.2008.01.029 |
| [7] |
魏洪涛, 王怒涛, 黄炳光. 两种新型水驱特征曲线系列[J]. 西南石油大学学报(自然科学版), 2009, 31(6): 117-122. WEI Hongtao, WANG Nutao, HUANG Bingguang. Two new types of water flooding characteristic curve series[J]. Journal of Southwest Petroleum University (Science & Technology Edition), 2009, 31(6): 117-122. doi: 10.3863/j.-issn.1674-5086.2009.06.026 |
| [8] |
WANG Jiqiang, SHI Chengfang, JI Shuhong, et al. New water drive characteristic curves at ultra-high water cut stage[J]. Petroleum Exploration and Development, 2017, 44(6): 1010-1015. doi: 10.1016/S1876-3804(17)30113-1 |
| [9] |
SONG Zhaojie, LI Zhiping, LAI Fengpeng, et al. Derivation of water flooding characteristic curve for high water-cut oilfields[J]. Petroleum Exploration and Development, 2013, 40(2): 216-223. doi: 10.1016/S1876-3804(13)60025-7 |
| [10] |
肖阳, 蔡振忠, 江同文, 等. 缝洞型碳酸盐岩油藏水驱特征曲线研究[J]. 西南石油大学学报(自然科学版), 2012, 34(6): 87-93. XIAO Yang, CAI Zhenzhong, JIANG Tongwen, et al. The study on water drive characteristic curve of fracturedvuggy carbonate reservoir[J]. Journal of Southwest Petroleum University (Science & Technology Edition), 2012, 34(6): 87-93. doi: 10.3863/j.issn.1674-5086.2012.06.012 |
| [11] |
YUE Ping, XIE Zhiwei, LIU Haohan, et al. Application of water injection curves for the dynamic analysis of fractured-vuggy carbonate reservoirs[J]. Journal of Petroleum Science and Engineering, 2018, 169: 220-229. doi: 10.1016/j.petrol.2018.05.062 |
| [12] |
孙雷, 冯乔, 陈国利, 等. CO2混相驱拟含气率与采出程度图版的建立[J]. 西南石油大学学报(自然科学版), 2014, 36(1): 83-88. SUN Lei, FENG Qiao, CHEN Guoli, et al. Establishment of the chart of equivalent gas ratio-recovery degree for CO2 miscible flooding[J]. Journal of Southwest Petroleum University (Science & Technology Edition), 2014, 36(1): 83-88. doi: 10.11885/j.issn.1674-5086.2013.10.14.06 |
| [13] |
苑志旺, 杨宝泉, 杨莉, 等. 注气驱油藏新型气驱特征曲线推导及应用[J]. 西南石油大学学报(自然科学版), 2018, 40(2): 135-141. YUAN Zhiwang, YANG Baoquan, YANG Li, et al. Derivation and practice of the new gas flooding characteristic curve of reservoir with gas injection flooding[J]. Journal of Southwest Petroleum University (Science & Technology Edition), 2018, 40(2): 135-141. doi: 10.11885/j.-issn.1674-5086.2017.04.23.01 |
| [14] |
LIU Zhibin, LIU Haohan. An effective method to predict oil recovery in high water cut stage[J]. Journal of Hydrodynamics, Ser. B, 2015, 27(6): 988-995. doi: 10.-1016/S1001-6058(15)60561-3 |
| [15] |
郑威, 杜志敏, 汪周华, 等. 相渗曲线对凝析气井动态影响研究[J]. 西南石油大学学报, 2007, 29(2): 10-13. ZHENG Wei, DU Zhimin, WANG Zhouhua, et al. The influence of relative permeability curves on gas condensate well performance[J]. Journal of Southwest Petroleum University, 2007, 29(2): 10-13. doi: 10.3863/j.issn.1674-5086.2007.02.003 |
| [16] |
YUAN Zhiwang, YANG Baoquan, YANG Li, et al. Watercut rising mechanism and optimized water injection technology for deepwater turbidite sandstone oilfield:A case study of AKPO Oilfield in Niger Delta Basin, West Africa[J]. Petroleum Exploration and Development, 2018, 45(2): 302-311. doi: 10.1016/S1876-3804(18)30033-8 |
| [17] |
张金庆, 孙福街. 相渗曲线和水驱曲线与水驱储量的关系[J]. 新疆石油地质, 2010, 31(6): 629-631. ZHANG Jinqing, SUN Fujie. Quantitative relationship between relative permeability curve, water drive curve and waterflood reserve[J]. Xinjiang Petroleum Geology, 2010, 31(6): 629-631. |
| [18] |
王金勋, 刘庆杰, 杨普华, 等. 应用逾渗理论计算非稳态法油水相渗曲线[J]. 石油勘探与开发, 2001, 28(2): 79-82. WANG Jinxun, LIU Qingjie, YANG Puhua, et al. Calculating the relative permeability from displacement experiments based on percolation theory[J]. Petroleum Exploration and Development, 2001, 28(2): 79-82. doi: 10.-3321/j.issn:1000-0747.2001.02.024 |
| [19] |
戴胜群, 付波, 洪秀娥, 等. 油藏综合相渗曲线拟合方法[J]. 油气藏评价与开发, 2011, 1(3): 1-4. DAI Shengqun, FU Bo, HONG Xiu'e, et al. The methods to fit the curve of integrated relative permeability in reservoir[J]. Reservoir Evaluation and Development, 2011, 1(3): 1-4. doi: 10.3969/j.issn.2095-1426.2011.03.001 |
| [20] |
叶仲斌, 彭克宗, 吴小玲, 等. 克拉玛依油田三元复合驱相渗曲线研究[J]. 石油学报, 2000, 21(1): 49-54. YE Zhongbin, PENG Kezong, WU Xiaoling, et al. Oil field development[J]. Acta Petrolei Sinica, 2000, 21(1): 49-54. doi: 10.3321/j.issn:0253-2697.2000.01.009 |
| [21] |
陈元千. 水驱曲线法的分类、对比与评价[J]. 新疆石油地质, 1994, 15(4): 348-356. CHEN Yuanqian. Classification, correlation and evaluation of water-drive performance curve analysis method[J]. Xinjiang Petroleum Geology, 1994, 15(4): 348-356. |
| [22] |
邴绍献. 特高含水期相渗关系表征研究[J]. 石油天然气学报, 2012, 34(10): 118-120. BING Shaoxian. Study on relative permeability equation adapted at ultra-high water-cut stage[J]. Journal of Oil and Gas Technology, 2012, 34(10): 118-120. doi: 10.-3969/j.issn.1000-9752.2012.10.028 |
| [23] |
于卓熙.带有误差变量的自回归模型的回归函数的局部多项式估计[D].长春: 吉林大学, 2006: 4-8. YU Zhuoxi. Local polynomial estimator of the regression function in autoregressive models with errors in variables[D]. Changchun: Jilin University, 2006: 4-8. http://cdmd.cnki.com.cn/Article/CDMD-10183-2006092374.htm |
| [24] |
刘浩瀚. 概率论与数理统计[M]. 北京: 高等教育出版社, 2015: 113-115.
|
| [25] |
陈元千. 相对渗透率曲线和毛管压力曲线的标准化方法[J]. 石油实验地质, 1990, 12(1): 64-70. CHEN Yuanqian. Standardization on the curves of permeability and capillary pressure[J]. Experimental Petroleum Geology, 1990, 12(1): 64-70. |
| [26] |
董大鹏.低渗透油田油水两相渗流机理研究[D].成都: 成都理工大学, 2007: 71-78. DONG Dapeng. A study of percolation rules of oil-water two-phase flow in low-permeability reservoirs[D]. Chengdu: Chengdu University of Technology, 2007: 71-78. http://www.wanfangdata.com.cn/details/detail.do?_type=degree&id=Y1068425 |
 2019, Vol. 41
 图1(Fig. 1)


