2. School of Geology and Geophysics, The University of Oklahoma, Norman OK 73019, USA
针对目前唯一存在的陆陆碰撞构造事件,印度—欧亚板块的碰撞已引起全世界地质学者的广泛兴趣,从而展开了由碰撞而引起的青藏高原隆起机制的探索,并提出了多种构造模型(Tapponnier et al.,1982,2001;吴功建等,1991;蔡学林等,1996;高锐,1997;Royden et al.,1997;Zhang et al.,2004;Clark et al.,2005;Jiang and Jin,2005;Hubbard and Shaw,2009;Hubbard et al.,2010;Robert et al.,2010;Yin et al.,2010;Zhao et al.,2012;Guo et al.,2013;Wang et al.,2014)。其中,比较流行的模型包括两个端元模型: 1)逃逸模型: 通过地壳尺度的走滑断层实现了高原物质的大规模东向挤出,由此来解释因南北向缩短造成的物质运移(Tapponnier et al.,1982,2001);2)地壳流模型: 地壳中的低粘滞系数物质通过蠕变的方式从青藏高原的内部向北东和南东部扩散,驱动高原抬升和地壳加厚(Royden et al.,1997)。然而,这两种端元模型都有各自不能解释的问题,例如,逃逸模型预期的走滑速率与观测不符(Shen et al.,2000),且不能很好地解释远离逆冲走滑断裂的区域如何平稳地抬升,前人研究也显示通过走滑逆冲造成的缩短量很小,而且只限于上地壳(Hubbard and Shaw,2009;Wang et al.,2014)。地壳流模型可以合理地解释地壳的增厚以及抬升,但是前人的研究结果显示该模型所需要的低速带分布并不均一(Zhang,2013),而且该模型无法解释上地壳的脆性变形(曹建玲等,2009)。由此可见,充分认识青藏高原岩石圈结构是研究青藏高原隆升机制的必要前提。
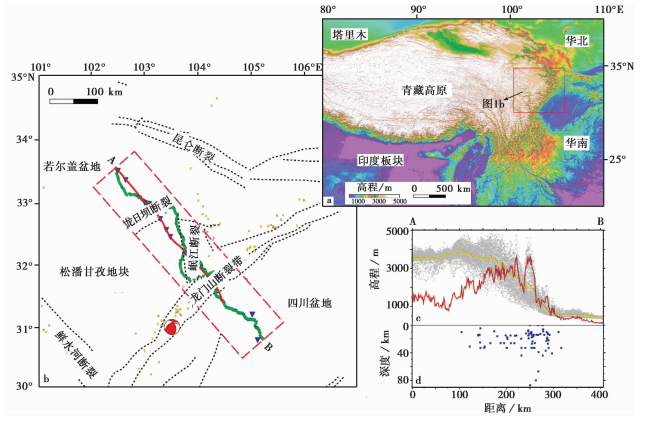
在本次研究中,我们对SinoProbe-02项目(图 1)横跨龙门山断裂带、全长400多公里长的宽角、折射地震数据及重力数据进行联合反演和综合解释,有针对性地讨论青藏高原东缘的岩石圈结构构造以及隆起机制。我们选择青藏高原东缘作为重点研究区域的出发点主要基于: 1)青藏高原东缘奇特的地理环境。作为青藏高原的东部边界,龙门山地区可以在100 km范围内从四川盆地500 m的海拔提升到3500 m以上海拔(王谦身等,2008)(图 1c),而地壳厚度可达50 km以上(Zhang,2013)。这种海拔增高、地壳增厚的现象引起了地质学家的广泛关注。2)青藏高原东缘特殊的地质位置: 龙门山断裂带从地形上分割了四川盆地和松潘甘孜地块。而在地质结构上,龙门山断裂带也是一个构造过渡带(Godard et al.,2009),从其西侧的活动构造单元过渡到东侧的四川盆地稳定地台。3)青藏高原东缘存在剧烈的构造活动。2008年汶川地震和2013年芦山地震提醒我们,龙门山及邻近地区是一个构造活动异常活跃的地区。该区域为历史上大地震的高发区域(图 1b),例如1879年7.8级岷江地震、1933年叠西地震、1960年漳腊地震以及最近的2001年昆仑山大地震(赵小麟等,1994;Liu et al.,1996;Burchfiel et al.,2008;张晁军等,2009;Wang et al.,2014)。因此本次研究结果也可以为探讨青藏高原的隆升机制提供理论依据。
|
图 1 研究区域地形和地质图 a. 区域高程图;b. 研究区域构造图。黑色虚线为断裂位置,黄色圆点为近百年6级以上地震位置,蓝色三角形为折射、宽角反射炮点位置,绿色三角形为检波器位置,红色实线为同期深反射地震剖面位置,红色虚线方框为图6b位置;c. 灰色点为图b红色虚线框中的点高程投影,黄色实线为平均高程,红色实线是根据平均高程计算的地形变化;d.图b红色虚线框中地震震中的投影 Fig.1 Regional topographic and geological map of the eastern Tibetan Plateau and Sichuan Basin, which shows the magnitude >6 earthquake epicenters |
青藏高原东缘龙门山断裂带的主要构造特性是逆冲形成的厚皮叠加构造(Chen and Wilson,1996;Hubbard and Shaw,2009)。断裂带自西向东由汶川断裂、北川断裂和和彭灌断裂3条北东走向主断裂组成。由于北川断裂的推覆作用,彭灌杂岩体和宝兴杂岩体出露于龙门山断裂带西南段。该杂岩体由类扬子克拉通元古代花岗岩轻度变质岩组成(Cook et al.,2013)。龙门山断裂带以东为四川盆地,具有刚性结晶基底,其上覆盖有中生代到新生代的沉积物(Kirby et al.,2002)。龙门山断裂带以西的松潘甘孜褶皱带广泛覆盖有数公里厚的三叠纪复理岩(许志琴等,1992;Kirby et al.,2002),同时还伴有大量的花岗岩出露,并切割三叠系褶皱带(胡健明等,2005;郭晓玉等,2014a,2014b)。
龙门山地区具有比较复杂的构造活动演化历史。裂变径迹测年显示汶川断裂和北川断裂在新生代被重新激活(Xu et al.,2008)。也有研究表明龙门山断裂带中最活跃的北川断裂带最近的活动年代是在12~5 Ma,平均的抬升速率是0.7~1.2 mm/yr(Burchfiel et al.,2008)。而水平方向上,龙门山造山带相对于四川盆地没有十分显著的缩短,平均缩短速率小于4 mm/yr(Zhang,2013)。Wang et al.(2012a)研究发现龙门山的抬升是不连续分期次的,两次快速抬升期(30~25 Ma和15~8 Ma)中间夹着一个缓慢抬升。可见龙门山及邻近地区构造复杂,新生代构造活动频繁的特点使其成为研究整个青藏高原隆起的重要地区之一。
2 地震数据采集本研究地震数据采集依托深部探测SinoProbe-02项目,于2011年由中国地质科学院地质研究所岩石圈中心和美国俄克拉荷马大学合作,在横穿龙门山地区做深反射地震剖面的同时,收集了宽角反射和折射地震数据,用来观测从四川盆地穿越西扬子古生代到青藏高原东部松潘甘孜地块的地壳结构特点。其中深反射剖面全长为310 km,配置3种不同级别的震源(24 kg、96 kg和500 kg),炮点间距对应为250 m、1 km和50 km。对应每一炮点设置600个检波器,间隔为50 m(Guo et al.,2013)。宽角反射和折射剖面全长大约为400 km,共有355个由IRIS提供的TEXAN地震检波器,间隔为1.5 km。共12次震源激发,从500 kg到2 t不等,由于客观条件限制,其中两炮信噪比较低,最终的速度结构计算由10次接收数据生成。由于地形、交通条件以及地震造成的塌方使得地震勘探条件十分困难,但是经过处理的深反射地震数据结果仍比较出色(Guo et al.,2013;郭晓玉等,2014b)。
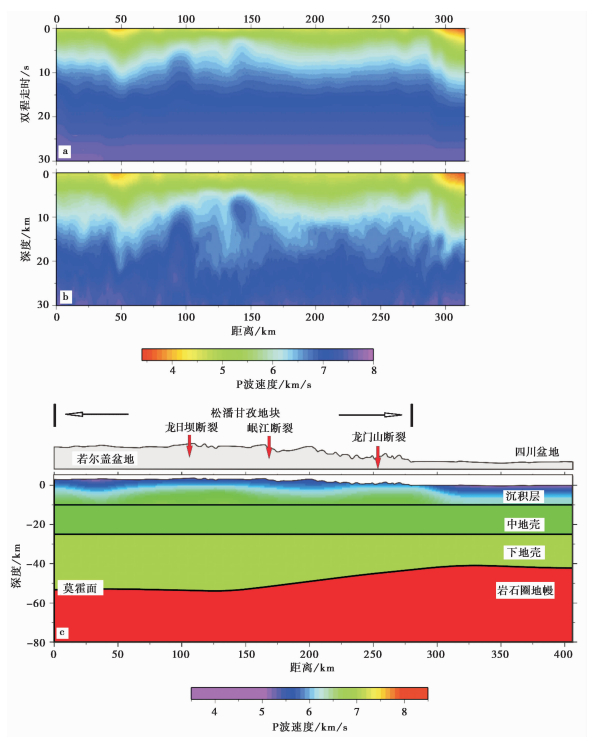
2.1 宽角反射和折射数据处理1)拾取走时。龙门山地区地形变化大、道路崎岖、环境复杂、噪音大等原因使得震像识别存在困难。因此我们根据已有的深反射地震数据和前人的地壳结构研究先建立正演模型,再通过正演结果对比实际数据进行震像拾取。同时对原始数据通过滤波、振幅调节和去道等方法(Zelt and Forsyth,1994)提高分辨率。走时的拾取主要是4种P波震像: P1、P2、PmP和Pn。 其中P1和P2为壳内反射,PmP和Pn为莫霍面反射和岩石圈地幔折射。为了提高正演结果的准确度,将深反射地震数据的叠加速度转化为层速度(图 2a、图 2b),以此为基础建立正演速度模型(图 2c)。深反射地震数据的浅层分辨率远远高于宽角反射和折射数据,因此不再拾取宽角反射和折射地震中的直达波(Pg)。由于深反射剖面偏移距大约为30 km,因此正演模型的上部10 km处为深反射地震数据速度结果,10 km以下根据前人研究成果而定(Li et al.,2006;Wang et al.,2007;Zhang et al.,2011;Wang et al.,2012b;Zhang et al.,2013)。中地壳和下地壳速度分别为6.5 km/s和6.8 km/s,岩石圈地幔为8.1 km/s。其中上地壳、中地壳底界面深度分别为10 km和25 km,莫霍面深度依据Wang et al.(2010)利用接收函数获得的该区域地壳厚度设定(图 2c)。此模型也为速度计算的初始模型。
|
图 2 时间域叠加速度(a)、深度域层速度(b)及用于计算P波速的初始层速度模型(c) Fig.2 Stacking velocity model (a), interval velocity model(b) and initial velocity model (c) |
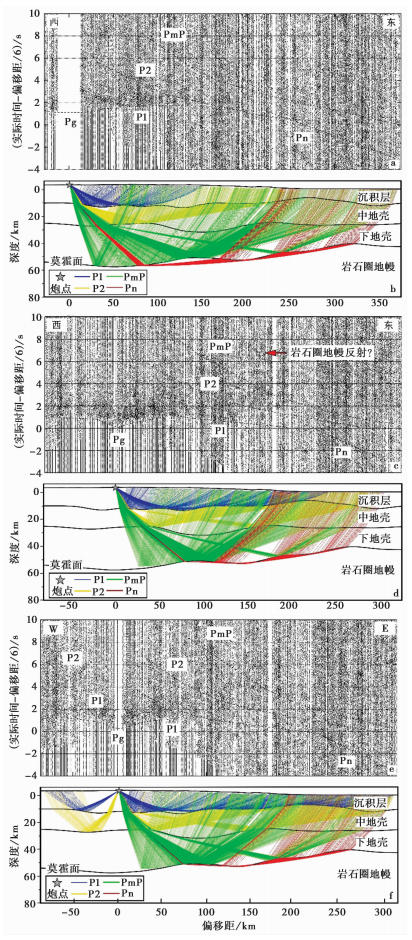
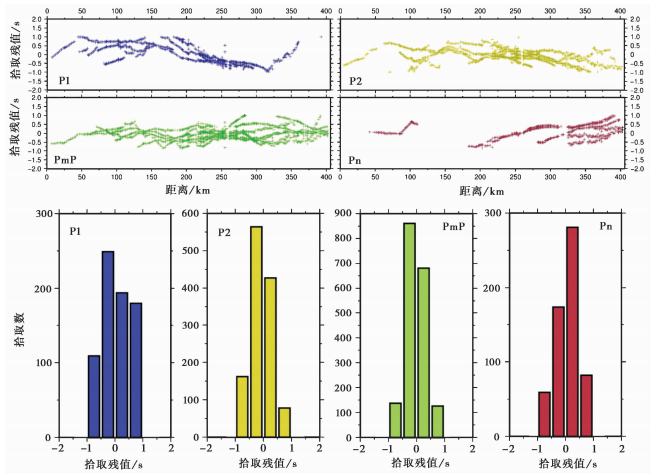
震像拾取的误差是由拾取软件计算得到的(Zelt and Forsyth,1994),其中壳内反射的误差为0.05 s,而莫霍面反射和折射拾取的误差为0.125 s。根据拾取结果(图 3),PmP显示莫霍面深度从松潘甘孜向四川盆地方向变浅,而莫霍面的折射出现在偏移距为200 km的四川盆地里,进入松潘后直到250 km才出现莫霍面折射。最后为了检验拾取的正确性,比较了拾取结果与根据最终速度模型计算的正演结果(图 4),P2、PmP和Pn的误差小于±0.5 s,震像P1误差较大。
|
图 3 炮2、炮3和炮4的震相拾取(a、c、e)及正演射线追踪(b、d、f) Fig.3 Observed record sections (a,c,e) and plots of the ray coverage from forward modelling(b,d,f) |
|
图 4 根据速度模型结果计算的正演结果和实际拾取时间的比较 Fig.4 Travel-time residual plot |
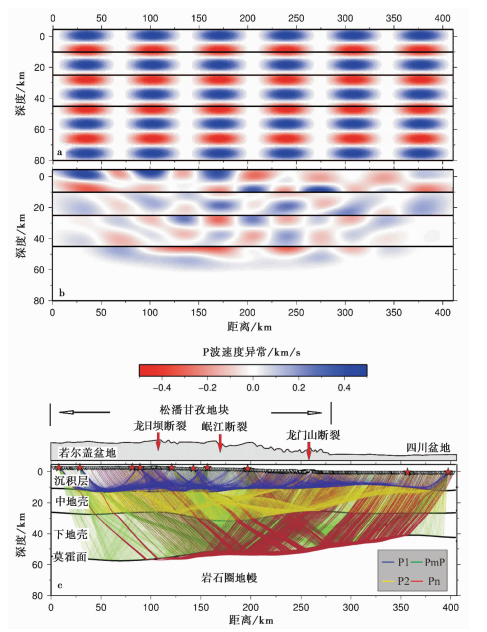
2)分辨率测试。本文利用Fast Marching Tomography Package(FMTOMO)开源代码(Rawlinson and Urvoy,2006)进行走时计算和射线追踪。此代码基于Sethian and Popovici提出的快速匹配方法(fast marching method)。为了计算方便,在初始速度模型的基础上将莫霍面深度设为45 km,上地壳速度设为5 km/s。对速度模型进行网格化,合成速度为初始模型速度±0.5 km/s(图 5a)。最后分辨率的测试为水平方向大约为50 km,垂向方向为10 km(图 5b)。浅层分辨率高于深部,中间部分高于两侧。用于射线追踪计算结果的最终速度模型如图 5c所示,地壳上两层(中地壳+沉积层)的覆盖密度高于下地壳,龙门山地区射线覆盖密度高于松潘甘孜地区。
|
图 5 分辨率测试初始模型(a),分辨率测试结果(b)以及根据最终速度计算结果计算射线路径(c) Fig.5 The resolution test and ray coverage |
因为研究区地形变化大、交通条件差和人口密集等原因,宽角反射折射地震测线并不是直线,因此速度模型的计算采用三维计算的方式: 计算单元网格设置为20 km×20 km×2.25 km(经度×纬度×深度),初始模型的顶界面设为海拔5.5 km,底界面设为海平面以下85 km;初始模型的速度和界面跟射线追踪用到的正演模型一样;速度和层界面深度的反演是自上而下,一层一层依次往下计算的。
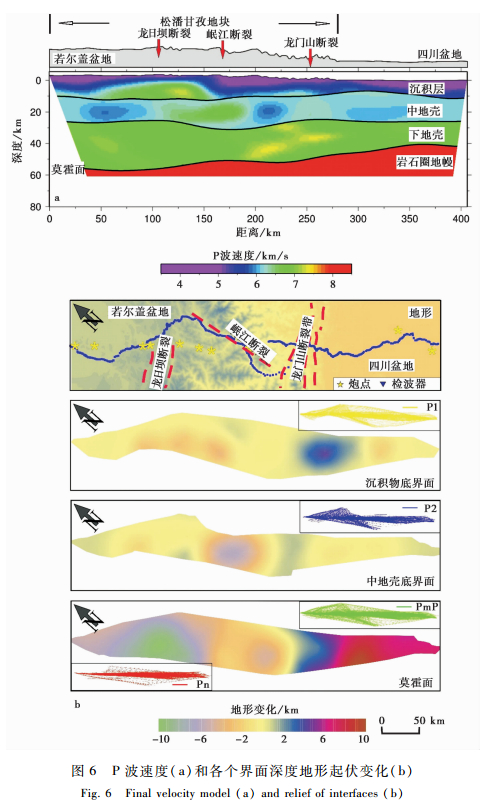
最终计算结果为4层速度模型,包括上地壳、中地壳、下地壳和上地幔。最上层上地壳为沉积层,被两条主要断裂(龙日坝断裂和龙门山断裂带)分割成3部分(图 6a);龙门山断裂带以西大部分区域被三叠纪复理岩覆盖,下覆为古生代层(Yin and Harrison,2000;Xiao et al.,2007);龙门山断裂带以东的四川盆地主要是白垩纪和第四系沉积层(Richardson et al.,2008;Liu et al.,2012)。上地壳中最低速度大约为3.6 km/s,位于四川盆地内;龙日坝断裂与岷江断裂之间出现的高速体可能是由埃达克岩类花岗岩类侵入造成的,由元古宙基底部分熔融形成(Zhang et al.,2006;Guo et al. 2013)。中地壳速度变化相对于沉积层比较均一,低速带出现在若尔盖盆地和龙门山断裂带下方;最厚的部分位于岷江断裂下方和四川盆地靠近龙门山断裂带地区,主要是因为受到西部应力的挤压和四川盆地基底的阻挡,这部分区域依靠缩短增厚的应变来吸收应力累计。下地壳厚度从西往东减薄,位于若尔盖盆地下方的高速体在深反射剖面中表现为强反射界面(Guo et al.,2013)。
|
图 6 P波速度(a)和各个界面深度地形起伏变化(b) Fig.6 Final velocity model (a) and relief of interfaces (b) |
为了在同一尺度下显示各个界面的起伏(图 6b),每个界面深度为实际深度与该层平均深度的差值。结果显示沉积物底界面在龙门山地区最浅,这是由于断裂的逆冲造成的(Hubbard and Shaw,2009;Guo et al.,2013)。中地壳底界面在龙门山西侧加深,上覆有低速体存在,推测此处中地壳因吸收挤压变形造成,该部分的缩短增厚抬升了上覆的沉积层。下地壳底界面即莫霍面深度由松潘甘孜地块向四川盆地变浅,这与该地区的接收函数结果相符(He et al.,2014)。
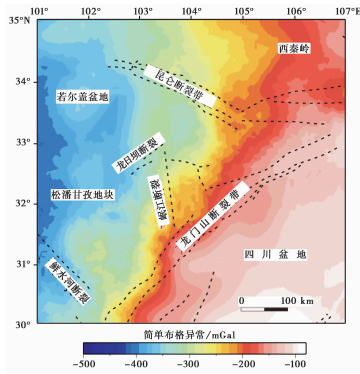
3 重力数据处理和建模本研究用到的重力异常数据是从 ICGEM(International Center for Global Earth Models)下载的简单布格异常,其质量补偿密度为2.67 g/cm3。根据本文速度模型结果和Gardner 法则(Gardner et al.,1974),上地壳沉积物密度为2.3~2.4 g/cm3,因此下载的数据需要做一个修正,平均密度按2.4 g/cm3计算。经过矫正,松潘甘孜地块的简单布格异常可以增加大约30 mGal。用于修正计算的高程数据为分辨率为30 m的SRTM数据,由于分辨率高于重力数据,因此矫正结果出现了一些噪点(图 7)。简单布格重力梯度带清楚地显示地壳厚度从北西向南东减薄。沿龙门山断裂带,重力异常梯度从南西往北东变宽,这可能是由于南西部龙门山地区受挤压比北东段要强。除了龙门山区域这个过渡带,松潘甘孜地块内部还存有部分高异常体,这些高异常可能与中生代深层岩有一定关联(Kirby et al.,2002;Roger et al.,2004;Chen et al.,2009)。
|
图 7 简单布格重力异常值 Fig.7 Simple Bouguer gravity anomaly map |
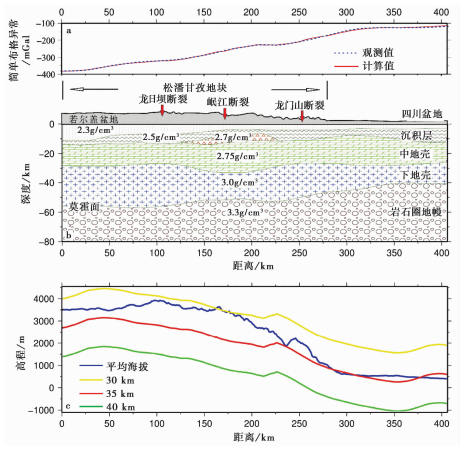
为了验证宽角反射和折射地震数据的处理结果,利用二维重力建模的方法对比现有观测到的布格重力异常: 首先二维重力模型的层界面源于宽角反射和折射地震数据,由于中下地壳速度变化不大,通过Nafe-Drake 法则(Brocher,2005)把中下地壳平均P波速度转化为层密度,因上地壳内沉积物密度变化大,则根据重力异常来调节密度分布(图 8a、图 8b)。结果显示,简单布格重力异常与莫霍面变化一致,上地壳内地层分布与速度结构有一定差异。三叠纪的复理石岩层厚度在松潘甘孜内部从西往东减薄,最厚处为12 km。由于龙门山断裂的挤压逆冲,沉积层底部在龙门山地区最浅,并向两边加深。在速度模型中出现的位于上地壳底部、岷江断裂下方的高速体在重力模型中密度为2.7g/cm3,这一高密度、高速度的构造被解释为元古宙基底在中生代由于部分熔融形成(Zhang et al.,2006)。中下地壳厚度不均匀的变化可能是由于四川盆地刚性基底的阻挡,加上自西往东的挤压造成的。中地壳最厚的部分出现在紧靠龙门山断裂带以西的位置,而下地壳的最厚部分出现在松潘甘孜地块下方,这可能是不同地层增厚过程的不同造成的。
|
图 8 二维重力建模正演重力异常计算结果和实际观测重力异常比较(a),二维重力建模(b)以及根据不同初始地壳厚度计算在均衡条件下地表海拔高度(c) Fig.8 Observed and computed Bouguer anomalies(a),final 2D integrated gravity model density model(b) and isostatic elevation and current mean elevation based on different original crustal thicknesses(c) |
根据地震和重力数据分析结果,在龙门山及邻近地区地壳厚度可达50多公里,平均海拔3 km,最高处超过4 km。Wang et al.(2010)认为,在平均陆壳厚度40 km的基础上再增厚28 km才能支撑海拔4 km的高度。而龙门山地区的平均海拔为3 km,大约需要60 km厚的地壳才能支撑。假设没有外部应力存在,在均衡状态下,龙门山及邻区现有地壳厚度能支撑多少高度?该区域的初始地壳厚度不详,本文用全球平均地壳厚度(Zandt and Ammon,1995)来代替,为30~40 km。
根据地壳层结构和密度分布,用以下公式计算高程:
| $H = \left[ {\left({{h_c} - {h_0}} \right){\rho _m} + {h_o}{\rho _c} - {h_s}{\rho _s} - {h_{mc}}{\rho _{mc}} - {h_{lc}}{\rho _{lc}}} \right]/{\rho _s}$ | (1) |
式中,H是高程,沿剖面每隔1.5 km一个点;hc 是莫霍面深度/km,h0 是初始的地壳厚度/km,海拔为0 km,我们计算了3个不同的初始地壳厚度,分别为30 km、35 km和40 km;hs 是沉积物厚度/km;hmc 是中地壳厚度/km;hlc 是下地壳厚度/km。每层对应密度为: ρm为上地幔密度;ρc为初始地壳平均密度(Wang et al.,2010);ρs为沉积物密度;ρmc为中地壳密度;ρlc为下地壳密度。由于四川盆地为刚性基底,挤压变形小,因此计算高程结果以四川盆地海拔为判断标准。计算结果(图 8c)显示初始地壳厚度为35 km时的高程最贴合四川盆地的平均海拔(700~800 m),以35 km厚的初始地壳为基础,在均衡状态下既使再增厚到现在的厚度也无法支撑现有的龙门山及以西地区的高度。因此除了地壳增厚、物质填充,刚性四川盆地基底在挤压作用下产生的弯曲应力也是该地区抬升的重要因素。
5 结 论龙门山及邻近地区地壳结构包括上地壳、中地壳和下地壳。上地壳的上层为沉积层,被两条主要断裂(龙日坝断裂和龙门山断裂带)分割成3部分(图 6a)。龙门山断裂带以西大部分区域被三叠纪复理岩覆盖,下覆为古生代沉积物。龙门山断裂带以东四川盆地主要是白垩纪和第四系沉积层,上地壳中最低速度大约为3.6 km/s,位于四川盆地内。龙日坝断裂与岷江断裂之间出现的高速体密度为2.7g/cm3。沉积物底界面在龙门山地区最浅。中地壳速度变化相对于沉积层比较均一,低速带出现在若尔盖盆地和龙门山断裂带下方。中地壳界面在龙门山西侧加深,最厚的部分位于岷江断裂下方和四川盆地靠近龙门山断裂带地区,主要是受西部应力挤压和四川盆地基底的阻挡,使得这部分区域依靠缩短增厚的应变来吸收应力累计,抬升了上覆的沉积层。下地壳厚度从西往东减薄,下地壳中位于若尔盖盆地下方的高速体在深反射剖面中表现为强反射界面。通过计算发现仅靠现有的地壳厚度和物质组成不能支撑龙门山及邻近地区的现有高度,四川盆地刚性基底在挤压作用下产生的弯曲应力是该地区抬升的重要条件之一。
| [1] | 蔡学林,魏显贵,刘援朝等. 1996. 论楔入造山作用--以龙门山造山带为例.四川地质学报, 16(2):97-102. |
| [2] | Cai Xuelin, Wei Xiangui, Liu Yuanchao et al. 1996. On wedge-in orogeny:On the example of the Longmenshan orogenic belt. Acta Geologica Sichuan, 16(2):97-102. |
| [3] | 曹建玲,石耀霖,张怀等. 2009. 青藏高原GPS位移绕喜马拉雅东构造结顺时针旋转成因的数值模拟.科学通报, 54(2):224-234. |
| [4] | Cao Jianling, Shi Yaoling, Zhang Huai et al. 2009. Numerical simulation of GPS observed clockwise rotation around the eastern Himalayan syntax in the Tibetan Plateau. Chinese Science Bulletin, 54(8):1398-1410. |
| [5] | 高锐. 1997. 青藏高原岩石圈结构与地球动力学的30个为什么.地质论评, 43(5):460-464. |
| [6] | Gao Rui. 1997. Thirty problems of the lithospheric structure and geodynamics in the Qinghai-Xizang Plateau. Geological Review, 43(5):460-464. |
| [7] | 郭晓玉,高锐, Keller G R等. 2014a. 综合地球物理资料揭示青藏高原东缘龙日坝断裂带构造属性和大地构造意义.地球物理学进展, 29(5):2004-2012. |
| [8] | Guo Xiaoyu, Gao Rui, Keller G R et al. 2014a. Integrated geophysical study on the tectonic feature of the Longriba fault zone in the eastern Tibetan Plateau, and the tectonic implications. Progress in Geophysics, 29(5):2004-2012. |
| [9] | 郭晓玉,高锐, Keller G R等. 2014b. 龙门山断裂带隆起造山独特性探讨.地质科学, 49(4):1337-1345. |
| [10] | Guo Xiaoyu, Gao Rui, Keller G R et al. 2014b. Discussion on the mountain building process of the Longmen Shan range. Chinese Journal of Geology, 49(4):1337-1345. |
| [11] | 胡健民,孟庆任,石玉若等. 2005. 松潘-甘孜地体内花岗岩锆石SHRIMP U-Pb定年及其构造意义.岩石学报, 21(3):867-880. |
| [12] | Hu Jianmin, Meng Qingren, Shi Yuruo et al. 2005. SHRIMP U-Pb dating of zircons from granitoid bodies in the Songpan-Ganzi terrane and its implications. Acta Petrologica Sinica, 21(3):867-880. |
| [13] | 王谦身,滕吉文,张永谦等. 2008. 龙门山断裂系及邻区地壳重力均衡效应与汶川地震.地球物理学进展, 23(6):1664-1670. |
| [14] | Wang Qianshen, Teng Jiwen, Zhang Yongqian et al. 2008. The effect of crustal gravity isostasy and Wenchuan earthquakes in Longmenshan faults and adjacent area. Progress in Geophysics, 23(6):1664-1670. |
| [15] | 吴功建,高锐,余钦范等. 1991. 青藏高原"亚东-格尔木地学断面"综合地球物理调查与研究.地球物理学报, 34(5):552-562. |
| [16] | Wu Guongjian, Gao Rui, Yu Qinfan et al. 1991. Integrated investigations of the Qinghai-Tibet Plateau along the Yadong-Golmud geoscience transect. Chinese Journal of Geophysics, 34(5):552-562. |
| [17] | 许志琴,侯立伟,王宗秀等. 1992. 中国松潘-甘孜造山带的造山过程.北京:地质出版社. 1-190. |
| [18] | Xu Zhiqin, Hou Liwei, Wang Zongxiu et al. 1992. Orogenic Processes of the Songpan-Ganze Orogenic Belt of China. Beijing:Geological Publishing House. 1-190. |
| [19] | 张晁军,石耀霖,马丽. 2009. 昆仑山大地震震后形变反映的地壳岩石流变特性.岩土力学, 30(9):2552-2558. |
| [20] | Zhang Chaojun, Shi Yaolin and Ma Li. 2009. Numerical simulation of curst rheological property reflected by post-seismic deformations of Kunlun large earthquake. Rock and Soil Mechanics, 30(9):2552-2558. |
| [21] | 赵小麟,邓起东,陈社发. 1994. 岷山隆起的构造地貌学研究.地震地质, 16(4):429-439. |
| [22] | Zhao Xiaolin, Deng Qidong and Chen Shefa. 1994. Tectonic geomorphology of the Minshan uplift in western Sichuan, southwestern China. Seismology and Geology, 16(4):429-439. |
| [23] | Brocher T M. 2005. Empirical relations between elastic wavespeeds and density in the Earth's crust. Bulletin of the Seismological Society of America, 95(6):2081-2092. |
| [24] | Burchfiel B C, Royden L H, Van Der Hilst R D et al. 2008. A geological and geophysical context for the Wenchuan earthquake of 12 May 2008, Sichuan, People's Republic of China. GSA Today, 18(7):4-11. |
| [25] | Chen S F and Wilson J L C. 1996. Emplacement of the Longmen Shan thrust-nappe belt along the eastern margin of the Tibetan Plateau. Journal of Structural Geology, 18(4):413-430. |
| [26] | Chen Y L, Li D P, Zhou J et al. 2009. U-Pb dating, geochemistry, and tectonic implications of the Songpan-Ganzi block and the Longmen Shan, China. Geochemical Journal, 43(2):77-99. |
| [27] | Clark M K, Bush J W M and Royden L H. 2005. Dynamic topography produced by lower crustal flow against rheological strength heterogeneities bordering the Tibetan Plateau. Geophysical Journal International, 162(2):575-590. |
| [28] | Cook K L, Royden L H, Burchfiel B C et al. 2013. Constraints on Cenozoic tectonics in the southwestern Longmen Shan from low-temperature thermochronology. Lithosphere, 5:393-406. |
| [29] | Gardner G H F, Gardner L W and Gregory A R. 1974. Formation velocity and density:The diagnostic basics for stratigraphic traps. Geophysics, 39(6):770-780. |
| [30] | Godard V, Pik R, Lavé J et al. 2009. Late Cenozoic evolution of the central Longmen Shan, eastern Tibet:Insight from(U-Th)/He thermochronometry. Tectonics, 28(5):doi:101029/2008TC002407. |
| [31] | Guo X Y, Gao R, Keller G R et al. 2013. Imaging the crustal structure beneath the eastern Tibetan Plateau and implications for the uplift of the Longmen Shan range. Earth and Planetary Science Letters, 379:72-80. |
| [32] | He C S, Dong S W, Santosh M et al. 2014. Seismic structure of the Longmenshan area in SW China inferred from receiver function analysis:Implications for future large earthquakes. Journal of Asian Earth Sciences, 96:226-236. |
| [33] | Hubbard J and Shaw J H. 2009. Uplift of the Longmen Shan and Tibetan Plateau and the 2008 Wenchuan(M=7.9)earthquake. Nature, 458:194-197. |
| [34] | Hubbard J, Shaw J H and Klinger Y. 2010. Structural setting of the 2008MW7.9 Wenchuan, China, Earthquake. Bulletin of the Seismological Society of America, 100(5B):2713-2735. |
| [35] | Jiang X and Jin Y. 2005. Mapping the deep lithospheric structure beneath the eastern margin of the Tibetan Plateau from gravity anomalies. Journal of Geophysical Research, 110(B7):doi:10.1029/2004JB003394. |
| [36] | Kirby E, Reiners P W, Krol M A et al. 2002. Late Cenozoic evolution of the eastern margin of the Tibetan Plateau:Inferences from 40Ar/39Ar and(U-Th)/He thermochronology. Tectonics, 21(1):1-20. |
| [37] | Li S L, Mooney W D and Fan J C. 2006. Crustal structure of mainland China from deep seismic sounding data. Tectonophysics, 420(1-2):239-252. |
| [38] | Liu S G, Deng B, Li Z W et al. 2012. Architecture of basin-mountain systems and their influences on gas distribution:A case study from the Sichuan Basin, South China. Journal of Asian Earth Sciences, 47:204-215. |
| [39] | Liu S G, Luo Z L, Dai S L et al. 1996. The uplift of the Longmenshan thrust belt and subsidence of the West Sichuan foreland basin. Acta Geologica Sinica, 9(1):16-26. |
| [40] | Rawlinson N and Urvoy M. 2006. Simultaneous inversion of active and passive source datasets for 3-D seismic structure with application to Tasmania. Geophysical Research Letters, 33(24):doi:10.1029/2006GL028105. |
| [41] | Richardson N J, Densmore A L, Seward D et al. 2008. Extraordinary denudation in the Sichuan Basin:Insights from low-temperature thermochronology adjacent to the eastern margin of the Tibetan Plateau. Journal of Geophysical Research, 113(B4):doi:10.1029/2006JB004739. |
| [42] | Robert A, Pubellier M, De Sigoye J et al. 2010. Structural and thermal characters of the Longmen Shan(Sichuan, China). Tectonophysics, 491(1-4):165-173. |
| [43] | Roger F, Malavieille J, Leloup Ph H et al. 2004. Timing of granite emplacement and cooling in the Songpan-Garzê fold belt(eastern Tibetan Plateau)with tectonic implications. Journal of Asian Earth Sciences, 22(5):465-481. |
| [44] | Royden L H, Burchfiel B C, King R W et al. 1997. Surface deformation and lower crustal flow in eastern Tibet. Science, 276(5313):788-790. |
| [45] | Shen Z K, Zhao C K, Yin A et al. 2000. Contemporary crustal deformation in East Asia constrained by global positioning system measurements. Journal of Geophysical Research, 105(B3):5721-5734. |
| [46] | Tapponnier P, Peltzer G, Le Dain A Y et al. 1982. Propagating extrusion tectonics in Asia:New insights from simple experiments with plasticine. Geology, 10(12):611-616. |
| [47] | Tapponnier P, Xu Z Q, Roger F et al. 2001. Oblique stepwise rise and growth of the Tibet Plateau. Science, 294(5547):1671-1677. |
| [48] | Wang C Y, Han W B, Wu J P et al. 2007. Crustal structure beneath the eastern margin of the Tibetan Plateau and its tectonic implications. Journal of Geophysical Research, 112(B7):doi:10.1029/2005JB003873. |
| [49] | Wang C Y, Lou H, Silver P G et al. 2010. Crustal structure variation along 30°N in the eastern Tibetan Plateau and its tectonic implications. Earth and Planetary Science Letters, 289(3-4):367-376. |
| [50] | Wang E, Kirby E, Furlong K P et al. 2012. Two-phase growth of high topography in eastern Tibet during the Cenozoic. Nature Geoscience, 5:640-645. |
| [51] | Wang M M, Jia D, Shaw J H et al. 2014. The 2013 Lushan earthquake:Implications for seismic hazards posed by the range front blind thrust in the Sichuan Basin, China. Geology, 42(10):doi:10.1130/G35809.1. |
| [52] | Wang Y X, Mooney W D, Yuan X C et al. 2012b. Crustal structure of the northeastern Tibetan Plateau from the southern Tarim Basin to the Sichuan Basin, China. Tectonophysics, 584:191-208. |
| [53] | Xiao L, Zhang H F, Clemens J D et al. 2007. Late Triassic granitoids of the eastern margin of the Tibetan Plateau:Geochronology, petrogenesis and implications for tectonic evolution. Lithos, 96(3-4):436-452. |
| [54] | Xu Z Q, Ji S C, Li H B et al. 2008. Uplift of the Longmen Shan range and the Wenchuan earthquake. Episodes, 31(3):291-301. |
| [55] | Yin A and Harrison T M. 2000. Geologic evolution of the Himalayan-Tibetan orogen. Annual Reviews of Earth and Planetary Sciences, 28:211-280. |
| [56] | Yin A. 2010. A special issue on the great 12 May 2008 Wenchuan earthquake(Mw7.9):Observations and unanswered questions. Tectonophysics, 491:1-9. |
| [57] | Zandt G and Ammon C J. 1995. Continental crust composition constrained by measurements of crustal Poisson's ratio. Nature, 374:152-154. |
| [58] | Zelt C A and Forsyth D A. 1994. Modeling wide-angle seismic data for crustal structure:Southeastern Grenville Province. Journal of Geophysical Research, 99(B6):11687-11704. |
| [59] | Zhang H F, Zhang L, Harris N et al. 2006. U-Pb zircon ages, geochemical and isotopic compositions of granitoids in Songpan-Garze fold belt, eastern Tibetan Plateau:Constraints on petrogenesis and tectonic evolution of the basement. Contribution to Mineralogy and Petrology, 152(1):75-88. |
| [60] | Zhang P Z, Shen Z K, Wang M et al. 2004. Continuous deformation of the Tibetan Plateau from global positioning system data. Geology, 32(9):809-812. |
| [61] | Zhang P Z. 2013. A review on active tectonics and deep crustal processes of the western Sichuan region, eastern margin of the Tibetan Plateau. Tectonophysics, 584:7-22. |
| [62] | Zhang Z J, Deng Y F, Teng J et al. 2011. An overview of the crustal structure of the Tibetan Plateau after 35 years of deep seismic soundings. Journal of Asian Earth Sciences, 40(4):977-989. |
| [63] | Zhang Z J, Deng Y F, Chen L et al. 2013. Seismic structure and rheology of the crust under mainland China. Gondwana Research, 23(4):1455-1483. |
| [64] | Zhao G Z, Unsworth M J, Zhan Y et al. 2012. Crustal structure and rheology of the Longmenshan and Wenchuan Mw 7.9 earthquake epicentral area from magnetotelluric data. Geology, 40(12):1139-1142. |
2. School of Geology and Geophysics, The University of Oklahoma, Norman, OK, USA 73019
 2016, Vol. 51

