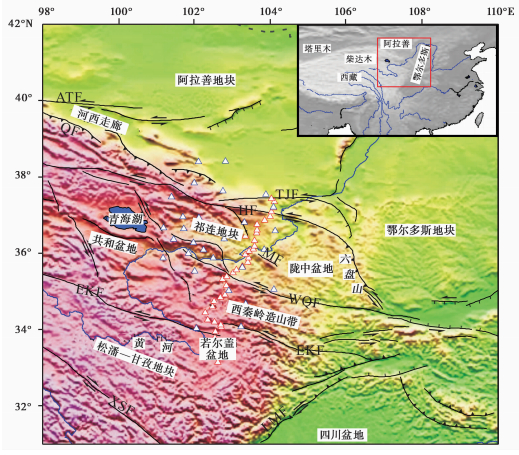
青藏高原东北缘被3条大型左旋走滑断裂带包围: 南侧是昆仑山断裂带、 西北侧是阿尔金断裂带,东北侧是海原断裂带。相邻的地体包括: 南侧的松潘—甘孜地体,西北侧的塔里木盆地、 北侧的阿拉善地块和东侧的鄂尔多斯地块(图 1 所示)。作为青藏高原与华北克拉通的过渡地带,青藏高原东北缘的岩石圈记录了高原向外扩展的岩石圈变形行为和演化过程。自印度—欧亚板块碰撞以来,随着青藏高原持续向北东方向发展(England and Houseman,1989; Tapponnier et al.,2001),使得距汇聚前缘约1 000 km的青藏高原东北缘地区发生了中-晚新生代以来的地表抬升和造山运动(Meyer et al.,1998; Tapponnier et al.,2001)。虽然高原东北缘与碰撞有关的断层、 沉积地层和抬升冷却所对应的年龄分布较宽(从碰撞开始至今),但多数研究都表明昆仑断裂以北大部分的新生代构造都晚于11 Ma(Meyer et al.,1998),也有研究认为高原东北缘的隆升主要发生在上新世—第四纪(Tapponnier et al.,2001)。因此,可以认为青藏高原东北缘尚处于地壳缩短和岩石圈变形的早期阶段,研究东北缘的岩石圈—软流圈边界(LAB)形态,可为青藏高原隆升和侧向生长研究提供边界约束,并深化对陆—陆碰撞远程效应和陆内造山过程、 机制的理解。

|
图 1 青藏高原东北缘地质构造和台站分布图(断层的运动方式参考 Yin et al.,2008) EKF. 昆仑断层;WQF. 西秦岭北缘断层;HF. 海原断层;TJF. 天景山断层;QF. 祁连山断层;ATF. 阿尔金断层;红色三角形为红原—景泰剖面的台站;蓝色三角形为甘肃、 青海区域台网的台站 Fig.1 Map of the northeastern Tibetan Plateau showing topography and major tectonic features(after Yin et al.,2008) |
随着地球物理观测水平的提高,近20年来,在青藏高原东北缘地区已开展了多期次的以揭示壳、 幔结构为目标的地球物理探测,然而,目前关于其岩石圈结构和形变模式的认识仍存在较大的争议。其中,岩石圈垂直连贯变形模型认为地壳和岩石圈地幔垂向上以相同的方式缩短增厚和侧向挤出(England and England and Houseman,1989),这一模型得到了地表形变观测(GPS)和上地幔各向异性的支持(Wang et al.,2008)。另外,地震学研究显示昆仑断裂带以北的柴达木盆地和祁连山逆冲推覆带下方存在地幔高速异常(Wittlinger et al.,1995; 丁志峰等,2001; Huang and Zhao,2006)和较深的LAB震相(Yue et al.,2012; Zhang et al.,2012),这些结果表明高原东北缘存在较厚的岩石圈地幔; 相反,壳—幔解耦模型提出亚洲大陆(包括柴达木盆地)岩石圈地幔也正向南俯冲到了松潘—甘孜地体岩石圈之下,然而不同学者关于岩石圈俯冲深度、 角度和前进距离存在不同认识(Kind et al.,2002; Wittlinger et al.,2004; Zhao et al.,2010; Zhao et al.,2011)。
可见,青藏高原东北缘的岩石圈结构和变形方式仍有待进一步研究和完善。本研究利用一条跨青藏高原东北缘的宽频带流动观测剖面(红原—景泰剖面)和部分甘肃、 青海区域台网的远震体波波形资料,通过S波接收函数方法获得了青藏高原东北缘的岩石圈—软流圈边界(LAB)图像,为揭示该地区岩石圈和地幔形变样式提供了深部地球物理证据和约束。
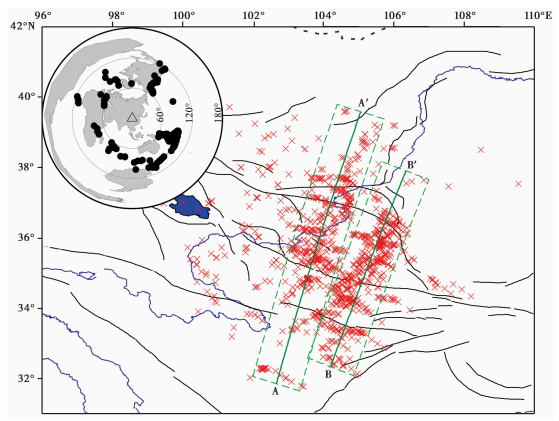
1 数据资料与研究方法 1.1 数据资料2011年9月~2013年2月,中国地质科学院地质研究所在SinoProbe项目的资助下,沿四川省红原县—甘肃省景泰县布设了一条密集流动地震台阵观测剖面,本研究利用该剖面的37个台站和甘肃、 青海区域台网的30个台站(图 2 所示)的远震波形资料,进行青藏高原东北缘岩石圈—软流圈边界(LAB)形态的成像。研究中挑选震中距范围60°~120°,震级MS>5.8,S(SKS)波初至清晰的远震S波波形提取S波接收函数。地震事件的震中分布如图 3所示。

|
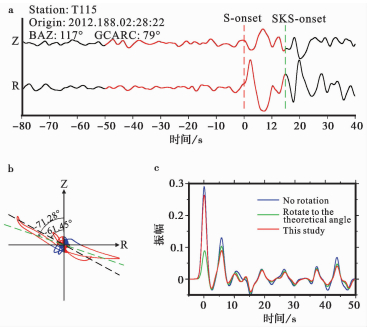
图 2 确定S波垂直偏振角度的示例 a. 地震波形,红色部分为提取S波接收函数所截取的数据,虚线标出位置为S(SKS)波初至时刻;b. 远震S波的理论偏振角(绿色虚线)和本研究估计的角度(黑色虚线);c. 不同方法计算的S波接收函数 Fig.2 An example for determining the vertical polarization angle of the S-wave |

|
图 3 研究中所使用的远震震中分布图和Sp震相在150 km深度的透射点分布 红色十字为Sp震相在150 km深度的透射点位置,左上角插图中三角形为台站T115,黑色圆圈为用于提取S波接收函数的远震震中分布,绿色直线为进行接收函数叠加和LAB成像的剖面位置,位于矩形框内的振幅会投影到剖面上 Fig.3 The epicenter distribution of the teleseismic events and the piercing points of Sp phase at depth of 150 km(red crosses) |
接收函数方法已广泛应用于壳、 幔结构和介质属性的研究,由于P波接收函数中来自莫霍面(Moho)的多次波与来自LAB的Ps转换波到达时间相当,很大程度上影响了LAB震相的识别; 而Sp转换波比S波传播得快,先于S波到达地震台站,多次波均滞后于S波到达,且Sp震相不会因传播路径上的介质各向异性而发生分裂,因此,利用Sp震相(即S波接收函数)研究岩石圈结构受其他震相干扰相对较小(Kumar et al.,2006; Wilson et al.,2006; Yuan et al.,2006),可以得到更为可靠的、 高分辨的岩石圈厚度信息。
提取S波接收函数的方法与P波接收函数相似,包括坐标旋转和反褶积计算两个步骤。首先,将三分量地震记录由地理坐标系(Z-N-E)旋转到台站坐标系(Z-R-T)下,对于P波接收函数来说,Ps转换波入射角较小,通常不超过15°(Wilson et al.,2006),垂直分量(Z)可作为入射P波的等效震源时间函数; 而S波接收函数中的Sp转换波入射角度最大可达45°(Wilson et al.,2006),因此还需要进行二次坐标旋转,即旋转到射线坐标系(P-SV-SH),以分离出S波的等效震源时间函数(即SV分量)。S波的垂向偏振角度可通过理论模型计算(Farra and Vinnik,2000)和波形分析(Vinnik,1977)来获得,本研究采用波形分析的方法来估计S波的垂直偏振角度。由于S波引起的质点振动方向与射线传播方向垂直,主要位于第二和第四象限(图 2b 所示),因此,我们在估计S波的垂直偏振角度时只对位于这个两个象限的质点振动进行拟合。考虑到S波初至振幅可作为评判S波接收函数质量的标准之一,我们利用Z和SV分量进行反褶积计算来提取S波接收函数,计算中采用了高斯系数α=1.0的低通滤波以提高信噪比,由于Sp震相与Ps震相的极性相反,且Sp波较S波传播得快,为了使S波接收函数与P波接收函数看起来相似,需要将反褶积得到的时间序列的时间轴和振幅极性反向。从图 2c可以看出,本研究得到的S波接收函数(图 2c 中的红色波形)较R和Z分量直接反褶积得到S波接收函数(图 2c 中的蓝色波形)信噪比高,其Moho和LAB的转换波与利用理论角度旋转得到的S波接收函数(图 2c 中的绿色波形)相似。
2 研究结果已有的地震探测研究表明青藏高原东北缘地壳平均厚度为50±5 km(Li et al.,2006; Liu et al.,2006; Zhang et al.,2010,2013; 高锐等,2011; Tian and Zhang,2013),为此,本研究将IASP91模型(Kennett and Engdahl,1991)的Moho深度修正到50 km,并以此作为参考速度模型来计算Sp震相的透射点位置和进行时—深转换计算。图 3展示了150 km深度处Sp震相的透射点位置,主要集中在松潘—甘孜地体东北部,西秦岭造山带和祁连地块东部,为研究这些地区的岩石圈厚度提供了数据基础。
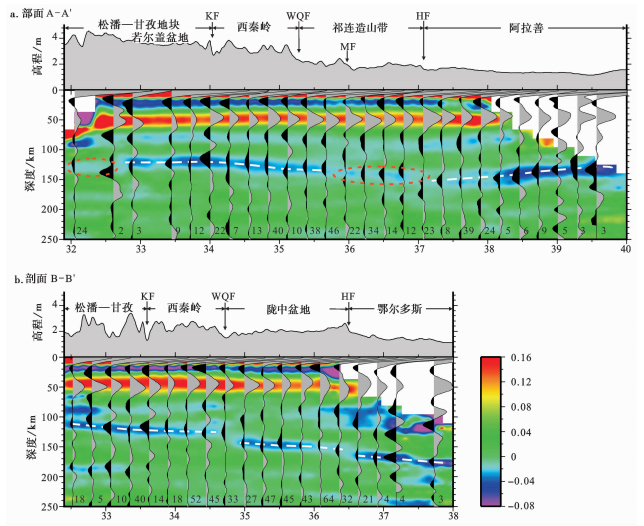
为了考察青藏高原东北缘LAB的横向变化,我们根据研究区的构造特征和150 km深度的透射点分布,进行了两条北东—南西向剖面的接收函数叠加和共转换点偏移成像(如图 3 A-A′、 图 3 B-B′所示)。接收函数叠加网格的宽度为1.4°,步长为0.4°,相邻网格存在1/3步长的覆盖,图 4展示了接收函数的叠加波形和偏移图像,考虑到地壳和地幔的横向非均匀性(5%的速度扰动),时—深转换过程可能会导致±4.0 km的误差,这对于岩石圈尺度的研究是可以接受的。

|
图 4 沿A—A′和B—B′剖面的叠加S波接收函数波形和偏移图像 波形底端数字为叠加的数据个数 Fig.4 The stacked S-wave receiver functions and image along the A-A′ and B′ profiles |
从图 4中可以识别出两个清晰的震相: 位于约50 km深度的正震相和110~160 km深度的负震相。其中正震相为来自Moho界面的Sp波,负震相可认为是来自LAB的Sp波,反映岩石圈底界的信息。具体来讲,沿A-A′剖面,若尔盖盆地和西秦岭造山带下方的LAB深度为120~130 km,略微向北加深,祁连造山带下方的LAB深度为130~140 km,但震相不聚焦,阿拉善地块下方的LAB深度由北侧的130 km向南加深到海原断裂带附近的150 km; 沿B-B′剖面,松潘—甘孜地体东北角和秦岭造山带下方的LAB深度为110~130 km,陇中盆地的LAB深度为140~150 km,鄂尔多斯地块的LAB深度为160~175 km。两条剖面中,昆仑断裂带下方均无明显LAB阶梯,剖面B-B′显示西秦岭北缘断裂带和海原断裂带下方存在LAB阶梯。
3 讨 论 3.1 松潘—甘孜地体与西秦岭造山带的岩石圈本研究得到的S波接收函数图像显示松潘—甘孜地体东北部和西秦岭造山带具有较薄的岩石圈,其厚度为110~130 km,这一结果与Su et al.(2010)由西秦岭石榴石相橄榄岩包体估计的岩石圈厚度(120 km)相当,同样,An and Shi(2006)由上地幔温度估算该地区的岩石圈厚度也仅为130 km。紧邻本研究区域南端,Zhang et al.(2010)和Hu et al.(2011)在青藏高原东缘的研究显示四川盆地西缘也具有超薄的岩石圈,他们的结果分别为70~80 km和100~120 km。这些研究均支持我们的S波接收函数结果。
昆仑断层可谓青藏高原东北缘重要的边界断裂带之一,其地表左旋走滑速率高达11 mm/yr(Tapponnier et al.,2001),然而,本研究结果显示其东端无明显岩石圈错断,推测昆仑断层的东端可能并没有切穿整个岩石圈,这一推测与深地震反射剖面获得的地壳精细结构相符,其结果显示昆仑断层自地表向下陡倾延伸到地壳中部的叠瓦状逆冲构造之上,在埋深约35 km处被近水平的拆离层所截断(高锐等,2011)。另外,深地震反射剖面还发现若尔盖盆地和西秦岭造山带的地壳均发育大型的构造不整合界面,层位一致,深度接近,上下地壳的反射面貌相仿,并且下地壳以北倾的强反射为主要特征,推测它们同属统一的稳定的大陆地块(高锐等,2006); 多尺度重磁异常分析显示松潘—甘孜和西秦岭造山带的基底性质相似,均具有扬子块体的构造属性(张季生等,2007); 同时,西秦岭地区的泥盆系中的碎屑锆石的U-Pb年龄(970~930 Ma)指示其与扬子克拉通具亲缘性(陈岳龙等,2008)。这些研究指示松潘—甘孜地体与西秦岭造山带可能曾属于一个完整的岩石圈板块,或具有相似的地质历史。
3.2 祁连地块的岩石圈属性祁连地块包括西部的祁连造山带和东部的陇中盆地,其中祁连造山带是一个古生代大洋俯冲带(万渝生等,2003),本研究的剖面A-A′刚好穿过祁连造山带的东边缘,图 4a显示这里的岩石圈底界转换波震相不聚焦,其原因可能为祁连块体曾经或正在发生着岩石圈—软流圈物质交换,导致岩石圈—软流圈物质成分差异变小、 波阻抗差降低,从而岩石圈—软流圈边界转换波震相不明显。如果岩石圈—软流圈物质交换发生在古生代造山时期,则整个祁连块体的岩石圈属性应该是一致的,而剖面B-B′却显示其东部陇中盆地的岩石圈底界震相非常明显,且聚焦很好(图 4b),因此,我们的研究更倾向于祁连造山带下方正在发生着岩石圈—软流圈物质交换作用。另外,层析成像研究(Huang and Zhao,2006)发现在祁连造山带的岩石圈下方存在大范围的地幔低速异常,这一低速、 热的地幔物质必然会影响其上覆岩石圈的属性。
3.3 鄂尔多斯与阿拉善地块的岩石圈作为华北克拉通的一部分,鄂尔多斯地块具有稳定、 少震和低地温梯度(Tao and Shen,2008)的特点,其下方保存有较厚的克拉通岩石圈地幔已被多数地球物理深部探测研究所证实(Huang and Zhao,2006; Li et al.,2006; Tian et al.,2011; Zhang et al.,2012),本研究显示鄂尔多斯西南边缘的LAB深达170 km(图 4),这一刚性块体势必在北东方向阻挡高原物质的前进。
阿拉善地块的属性一直以来饱受争议,虽然它与鄂尔多斯同样是地震的空白区,然而有研究显示亚洲大陆的岩石圈地幔已俯冲到青藏高原东北缘下方(高锐等1998;吴功建等,1998; Kind et al.,2002; 董治平等,2007; Zhao et al.,2010),陆—陆碰撞的远程效应已越过阿尔金—海原断裂带,到达了龙首山—天景山地区(董治平等,2007; Gao et al.,2013),本研究显示阿拉善地块东端存在向祁连造山带下方汇聚的趋势,但尚未通过海原断裂带,这与地质学研究的推论一致(Meyer et al.,1998; Tapponnier et al.,2001)。
本研究获得的青藏高原东北缘岩石圈底界形态可为高原扩展研究提供重要深部证据,据初步分析可以认为,在印度板块俯冲的推动力作用下,青藏高原持续向北东方向扩展,在鄂尔多斯块体西南缘,受到刚性克拉通岩石圈的阻挡; 北侧受到阿拉善地块向南的推挤和汇聚; 祁连造山带在双向挤压作用力下,地壳和岩石圈均发生了增厚,且增厚的岩石圈正在与下覆软流圈发生着物质交换作用,这一推测还有待更多资料证实。
| [1] | 陈岳龙,李大鹏,周建等. 2008. 中国西秦岭碎屑锆石U-Pb年龄及其构造意义.地学前缘, 15(4):88-107. |
| [2] | Chen Yuelong, Li Dapeng, Zhou Jian et al. 2008. U-Pb ages of zircons in western Qinling Mountain, China, and their tectonic implications. Earth Science Frontiers, 15(4):88-107. |
| [3] | 丁志峰,何正勤,吴建平等. 2001. 青藏高原地震波三维速度结构的研究.中国地震, 17(2):202-209. |
| [4] | Ding Zhifeng, He Zhengqin, Wu Jianping et al. 2001. Research on the 3-D seismic velocity structures in Qinghai-Xizang Plateau. Earthquake Research in China, 17(2):202-209. |
| [5] | 董治平,张元生. 2007. 河西走廊中部地区三维速度结构研究.地球学报, 28(3):270-276. |
| [6] | Dong Zhiping and Zhang Yuansheng. 2007. A study of the 3-D structure in central Hexi corridor. Acta Geoscientica Sinica, 28(3):270-276. |
| [7] | 高锐,李廷栋,吴功建. 1998. 青藏高原岩石圈演化与地球动力学过程--亚东-格尔木-额济纳旗地学断面的启示.地质论评, 44(4):389-395. |
| [8] | Gao Rui, Li Tingdong and Wu Hongjian. 1998. Lithospheric evolution and geodynamic process of the Qinghai-Tibet Plateau:An inspiration from the Yadong-Golmud-Ejin geoscience transect. Geological Review, 44(4):389-395. |
| [9] | 高锐,王海燕,马永生等. 2006松潘地块若尔盖盆地与西秦岭造山带岩石圈尺度的构造关系--深地震反射剖面探测成果.地球学报, 27(5):411-418 |
| [10] | Gao Rui, Wang Haiyan, Ma Yongsheng et al. 2006. Tectonic relationships between the Zoigê Basin of the Song-Pan block and the West Qinling orogen at lithosphere scale:Results of deep seismic reflection profiling. Acta Geoscientica Sinica, 27(5):411-418 |
| [11] | 高锐,王海燕,王成善等. 2011. 青藏高原东北缘岩石圈缩短变形-深地震反射剖面再处理提供的证据.地球学报, 32(5):513-520. |
| [12] | Gao Rui, Wang Haiyan, Wang Chengshan et al. 2011. Lithospheric deformation shortening of the northeastern Tibetan Plateau:Evidence from reprocessing of deep seismic reflection data. Acta Geoscientica Sinica, 32(5):513-520. |
| [13] | 万渝生,许志琴,杨经绥等. 2003. 祁连造山带及邻区前寒武纪深变质基底的时代和组成.地球学报, 24(4):319-324. |
| [14] | Wan Yusheng, Xu Zhiqin, Yang Jingsui et al. 2003. The Precambrian high-grade basement of the Qilian terrane and neighboring areas:Its ages and compositions. Acta Geoscientia Sinica, 24(4):319-324. |
| [15] | 吴功建. 1998. 岩石圈研究的重要问题与研究方向.地学前缘, 5(1-2):99-109. |
| [16] | Wu Gongjian. 1998. Key problems and orientation of the lithospheric research. Earth Science Frontiers, 5(1-2):99-109. |
| [17] | 张季生,高锐,李秋生等. 2007. 松潘-甘孜和西秦岭造山带地球物理特征及基底构造研究.地质评论, 53(2):261-267. |
| [18] | Zhang Jisheng, Gao Rui, Li Qiusheng et al. 2007. A study on geophysical characteristic and basement in the Songpan-Garze and western Qinling orogenic belt. Geological Review, 53(2):261-267. |
| [19] | An M J and Shi Y L. 2006. Lithospheric thickness of the Chinese continent. Physics of the Earth and Planetary Interiors, 159(3-4):257-266 |
| [20] | England P and Houseman G. 1989. Extension during continental convergence, with application to the Tibetan Plateau. Journal of Geophysical Research, 94(B12):17561-17579. |
| [21] | Farra V and Vinnik L. 2000. Upper mantle stratification by P and S receiver functions. Geophysical Journal International, 141(3):699-712. |
| [22] | Gao R, Wang H Y, Yin A et al. 2013. Tectonic development of the northeastern Tibetan Plateau as constrained by high-resolution deep seismic-reflection data. Lithosphere, 5(6):555-574. |
| [23] | Hu J F, Xu X Q, Yang H Y et al. 2011. S receiver function analysis of the crustal and lithospheric structures beneath eastern Tibet. Earth and Planetary Science Letters, 306(1-2):77-85. |
| [24] | Huang J L and Zhao D P. 2006. High-resolution mantle tomography of China and surrounding regions. Journal of Geophysical Research, 111(B9):doi:10.1029/2005JB004066. |
| [25] | Kennett B L N and Engdahl E R. 1991. Traveltimes for global earthquake location and phase identification. Geophysical Journal International, 105(2):429-465. |
| [26] | Kind R, Yuan X, Saul J et al. 2002. Seismic images of crust and upper mantle beneath Tibet:Evidence for Eurasia plate subduction. Science, 298(5596):1219-1221. |
| [27] | Kumar P, Yuang X H, Kind R et al. 2006. Imaging the colliding Indian and Asian lithospheric plates beneath Tibet. Journal of Geophysical Research, 111(B6):doi:10.1029/2005 JB003930. |
| [28] | Li S L, Mooney W D and Fan J C. 2006. Crustal structure of mainland China from deep seismic sounding data. Tectonophysics, 420(1-2):239-252 |
| [29] | Liu M J, Mooney W D, Li S L et al. 2006. Crustal structure of the northeastern margin of the Tibetan Plateau from the Songpan-Ganzi terrane to the Ordos Basin. Tectonophysics, 420(1-2):253-266 |
| [30] | Meyer B, Tapponnier P, Bourjot L et al. 1998. Crustal thickening in Gansu-Qinghai, lithospheric mantle subduction, and oblique, strike-slip controlled growth of the Tibet Plateau. Geophysical Journal International, 135(1):1-47. |
| [31] | Su B X, Zhang H F, Sakyi P A et al. 2010. Compositionally stratified lithosphere and carbonatite metasomatism recorded in mantle xenoliths from the western Qinling(central Chian). Lithos, 116(1):111-128 |
| [32] | Tao W and Shen Z K. 2008. Heat flow distribution in Chinese continent and its adjacent areas. Progress in Natural Science, 18(7):843-849. |
| [33] | Tapponnier P, Xu Z, Francoise R et al. 2001. Oblique stepwise rise and growth of the Tibet Plateau. Science, 294(5547):1671-1677. |
| [34] | Tian X B, Teng J W, Zhang H S et al. 2011. Structure of crust and upper mantle beneath the Ordos block and the Yinshan Mountains revealed by receiver function analysis. Physics of the Earth and Planetary Interiors, 184(3):186-193. |
| [35] | Tian X B and Zhang Z J. 2013. Bulk crustal properties in NE Tibet and their implications for deformation model. Gondwana Research, 24(2):548-559. |
| [36] | Vinnik L P. 1977. Detection of waves converted from P to SV in the mantle. Physics of the Earth and Planetary Interiors, 15(1):39-45. |
| [37] | Wang C Y, Flesch L M, Silver P G et al. 2008. Evidence for mechanically coupled lithosphere in central Asia and resulting implications. Geology, 36(5):363-366. |
| [38] | Wilson D C, Angus D A, Ni J F et al. 2006. Constraints on the interpretation of S-to-P receiver functions. Geophysical Journal International, 165(3):969-980. |
| [39] | Wittlinger G, Masson F, Poupinet G et al. 1995. Seismic tomography of northern Tibet and Kunlun:Evidence for crustal blocks and mantle velocity contrasts. Earth and Planetary Science Letters, 139(1-2):263-279. |
| [40] | Wittlinger G, Farra V and Vergen J. 2004. Lithospheric and upper mantle stratifications beneath Tibet:New insight from Sp conversions. Geophysical Research Letters, 31(19):doi:10.1029/2004GL020955. |
| [41] | Yuan X H, Kind R, Li X Q et al. 2006. The S receiver functions:Synthetics and data example. Geophysical Journal International, 165(2):555-564. |
| [42] | Yue H, Chen Y J, Sandvol E et al. 2012. Lithospheric and upper mantle structure of the northeastern Tibetan Plateau. Journal of Geophysical Research Atmospheres, 117(B5):doi:10.1029/2011JB008545. |
| [43] | Zhang H S, Teng J W, Tian X B et al. 2012. Lithospheric thickness and upper-mantle deformation beneath the NE Tibetan Plateau inferred from S receiver functions and SKS splitting measurements. Geophysical Journal International, 191(3):1285-1294. |
| [44] | Zhang Z J, Yuan X H, Chen Y et al. 2010. Seismic signature of the collision between the East Tibetan escape flow and the Sichuan Basin. Earth and Planetary Science Letters, 292(3):254-264. |
| [45] | Zhang Z J, Bai Z M, Klemperer S L et al. 2013. Crustal structure across northeastern Tibet from wide-angle seismic profiling:Constraints on the Caledonian Qilian orogeny and its reactivation. Tectonophysics, 606:140-159. |
| [46] | Zhao J M, Yuan X H, Liu H B et al. 2010. The boundary between the Indian and Asian tectonic plates below Tibet. Proceedings of the National Academy of Sciences of the United States of America, 107(25):11229-11233. |
| [47] | Zhao W J, Kumar P, Mechie J et al. 2011. Tibetan plate overriding the Asian plate in central and northern Tibet. Nature Geoscience, 4:doi:10.1038/NGEO1309. |
 2016, Vol. 51

